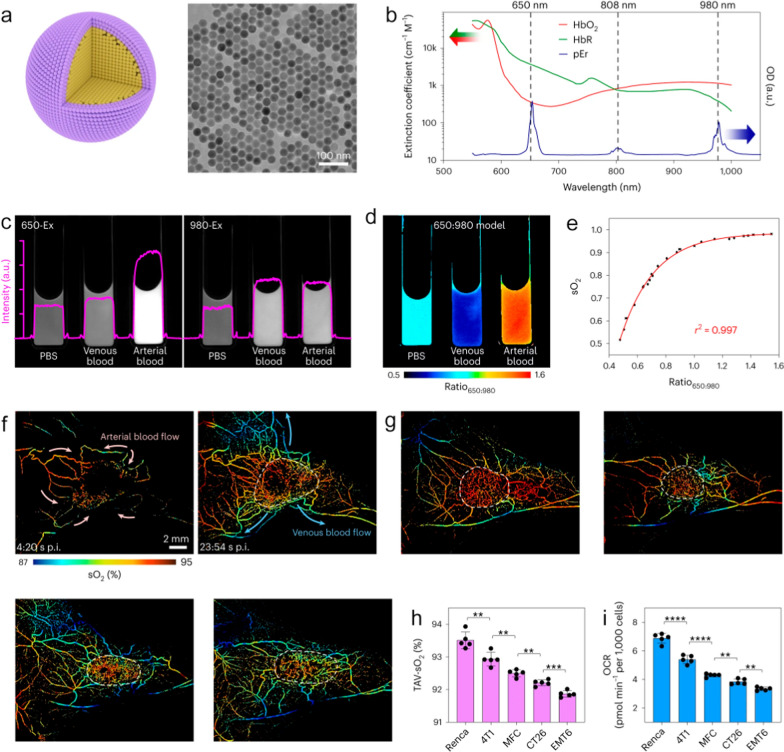
Fig. 9.
a Schematic illustration of a core–shell NaErF4@NaYF4 pEr nanoprobe (left) and corresponding large-scale transmission electron microscopy image (right). b Absorption spectra of HbO2, HbR and pEr. c NIR-IIb luminescence images of the pEr nanoprobe dispersed in PBS, mouse venous blood and arterial blood under 650-Ex and 980-Ex. d Heat map of the ratio650:980 reconstructed from the 650-Ex and 980-Ex channels. e The sO2 value of mouse blood samples, as measured by a blood-gas analyser, was plotted against the ratio650:980 to generate an empirical calibration formula. f Time-course dynamic sO2 imaging (650: 980 model) showing the perfusion of pEr into 4T1 tumor. The pink (left) and azure (right) arrows indicate the blood flow directions. g NIR-II sO2 imaging showed the tumor-associated vasculature of different tumors. h Statistical results of the average TAV-sO2 values within the tumor regions. i Basal oxygen consumption rate of these five types of cancer cell lines. Reproduced with permission from Zhong et al. [118]

