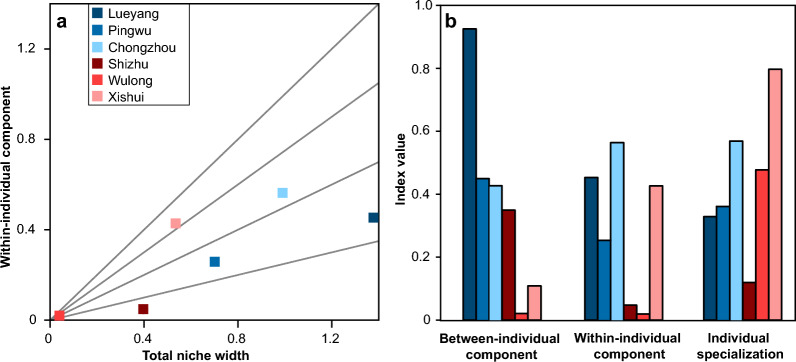
Fig. 5.
Trophic niche indices of the individual specialization of the northwestern and southeastern populations. a Relationship between within-individual component and population niche width. The four function lines indicate the ratio of within-individual component/total niche width. b Individual specialization comparison among six populations using δ15N data from muscles and bone collagens. The between-individual component, within-individual component and individual specialization of the six populations are shown. Shades of blue represent the three populations in the northwest, and shades of red represent the three populations in the southeast

