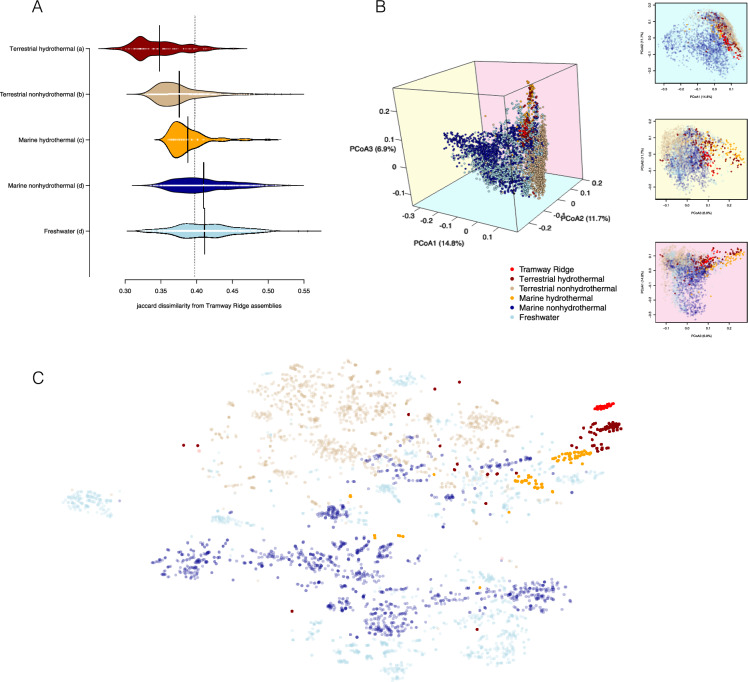
Fig. 2.
Exploration of pairwise Jaccard distance between Pfam-based functional profiles of public metagenomes. Profiles were constructed as vectors of Pfam presence-absence, and distance was calculated using the Jaccard Index (see methods for details) a Bean plot showing the distribution of dissimilarity between functional profiles from Tramway Ridge metagenomes and other broad environmental categories. The dashed vertical line indicates the median dissimilarity of all metagenomes. The categorical labels from a post hoc Tukey’s test are indicated for each environmental category. b 3-D principal coordinate analysis (PCoA) plot based on pairwise Jaccard distance between publicly available metagenomic assemblies and 2-D projections comparing each of the three first coordinate axes. Each point represents a single dataset. c t-distributed stochastic neighbor embedding (tSNE) projection of the data in b

