Fig. 5.
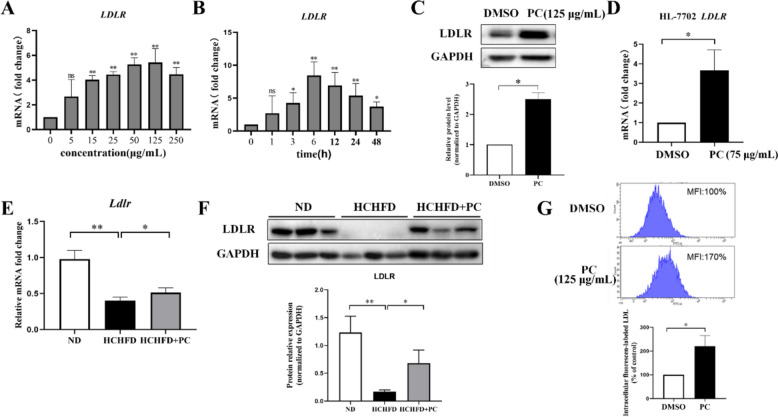
PC promoted LDL uptake through the upregulation of LDLR. A Dose–response effect of PC on LDLR expression in HepG2 cells (n = 3). B Time course of PC on LDLR expression in HepG2 cells (n = 4). C Representative Western blot analysis of LDLR and quantification of three independent Western blot analyses of HepG2 cells (n = 3). D Effect of PC on the LDLR mRNA level in HL-7702 cells (n = 3). E qRT-PCR analysis of the liver Ldlr gene in the rats from the three groups (n = 4). F Western blot analysis of the LDLR protein level in liver tissues and quantification of Western blots of three independent (n = 3) rat liver samples. G Representative result of LDL uptake and quantification result of three independent experiments (n = 3) for LDL uptake capacity of HepG2 cells. MFI: mean fluorescence intensity. Data are shown as the mean ± SD. For A, B statistical analyses were conducted using one-way analysis of variance (ANOVA) followed by Dunnett significant difference test. *p < 0.05; **p < 0.01. PC vs. DMSO or as indicated. The concentrations of PC for HepG2 and HL-7702 cell treatment were 125 μg/mL and 75 μg/mL, respectively

