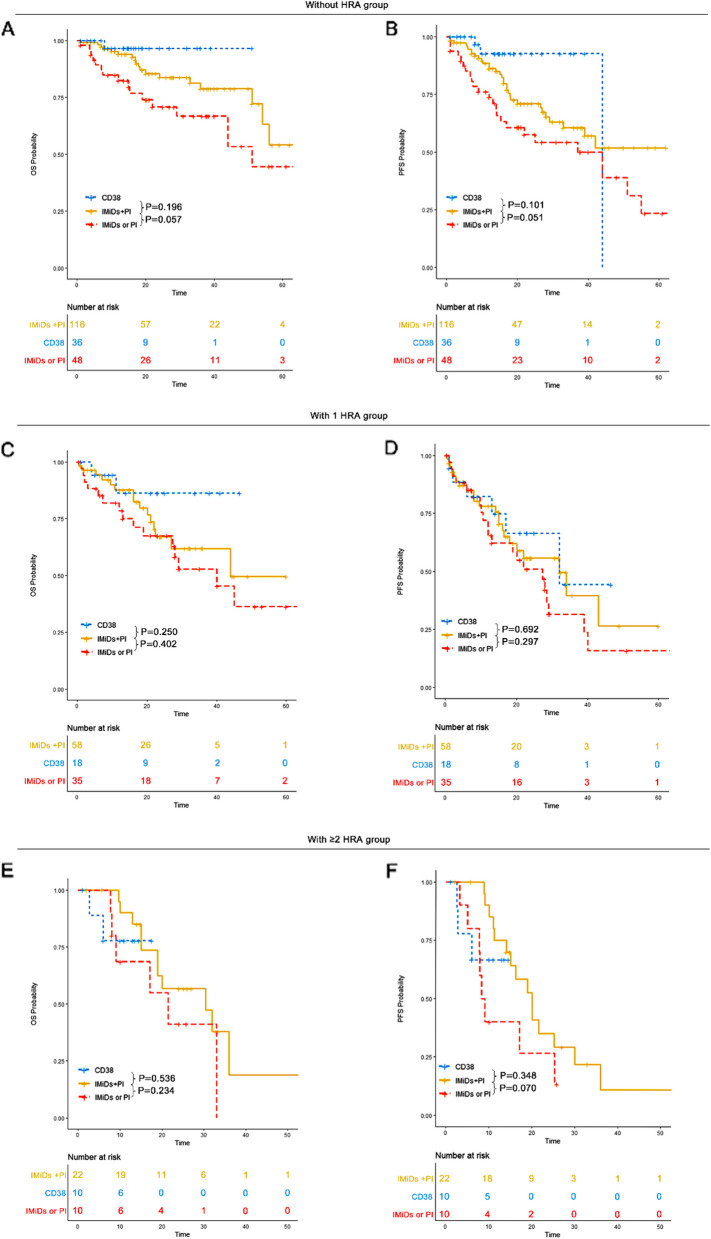
Fig. 6.
OS and PFS of patients across different induction treatment groups. A OS of patients across different induction treatment groups in the 0 HRA group. B PFS of patients across different induction treatment groups in the 0 HRA group. C OS of patients across different induction treatment groups in the 1 HRA group. D PFS of patients across different induction treatment groups in the 1 HRA group. E OS of patients across different induction treatment groups in the ≥ 2 HRA group. F PFS of patients across different induction treatment groups in the ≥ 2 HRA group

