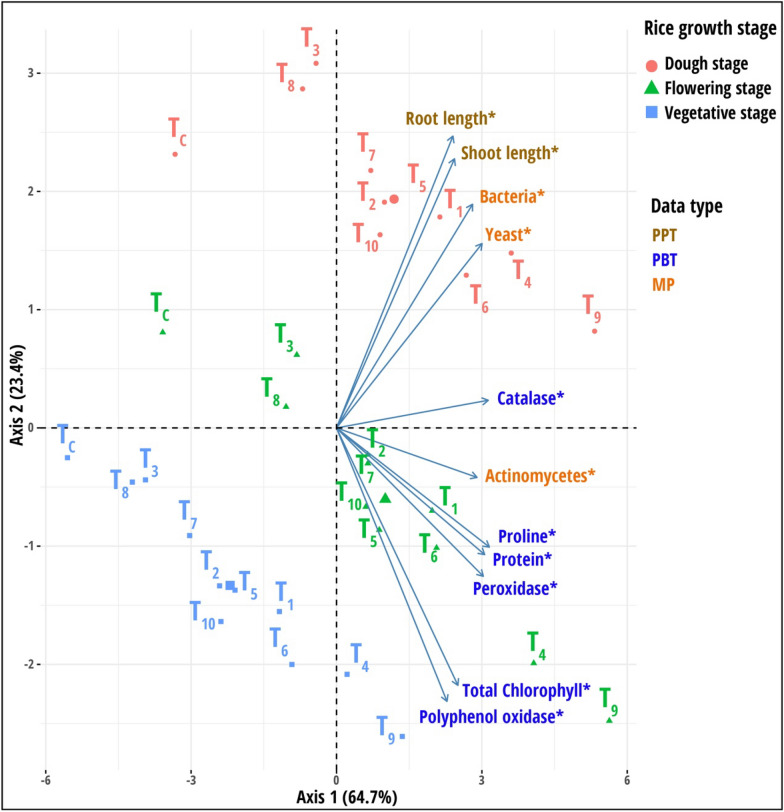
Fig. 4.
Results of principal component analysis (PCA) based on the integration of all dataset categories measured in pot culture experiment. Variables marked with an asterisk are significant along the first principal component axis obtained from the PCAtest analysis. The treatments are as follows: T1—Rhodotorula paludigena Y1 + 100% recommend dose of chemical fertilizers (RDCFs), T2—Pseudozyma sp. Y71 + 100% RDCFs, T3—Cryptococcus sp. Y72 + 100% RDCFs, T4—Yeast consortium (Rhodotorula paludigena Y1, Pseudozyma sp. Y71 and Cryptococcus sp. Y72) + 100% RDCFs, T5—100% RDCFs, T6—Rhodotorula paludigena Y1 + 75% RDCFs, T7—Pseudozyma sp. Y71 + 75% RDCFs, T8—Cryptococcus sp. Y72 + 75% RDCFs, T9—Yeast consortium (Rhodotorula paludigena Y1, Pseudozyma sp. Y71 and Cryptococcus sp. Y72) + 75% RDCFs, T10—75% RDCFs, and TC – Control. Data type abbreviations: PBT, plant biochemical traits; PPT, plant phenotypic traits; and MP, Microbial population

