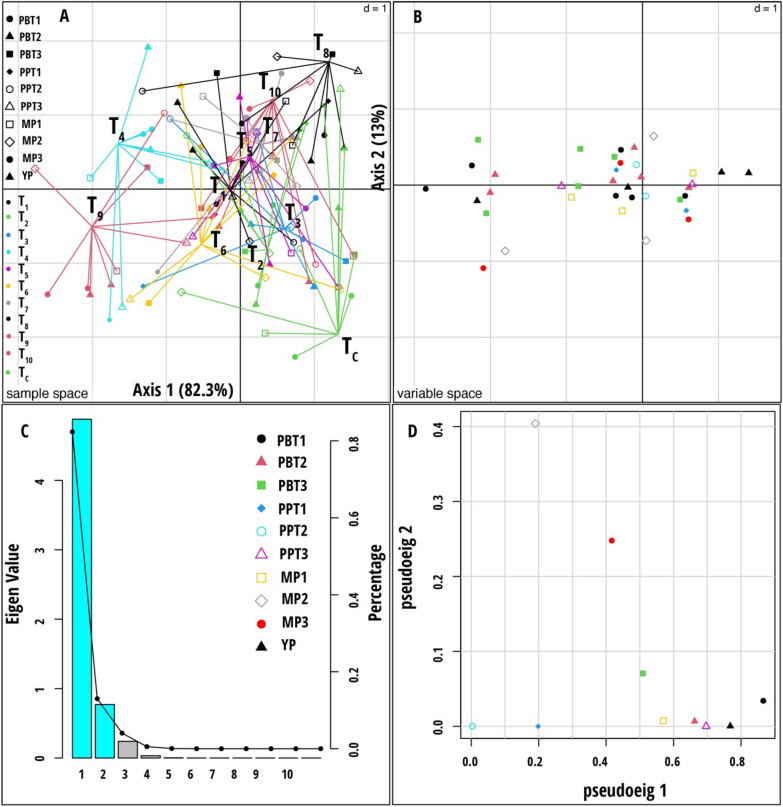
Fig. 6.
Multiple co-inertia analysis (MCIA) results based on nine data sets (Plant biochemical traits, plant phenotypic traits, and microbial population measured during stem elongation, flowering, and dough stages). A Plot of the first two components in the sample space. Each sample is represented by a colored shape, with lines connecting the nine datasets for each sample to a central point (MCIA global score). B Variable space for each data set. C A scree plot of absolute eigenvalues (bars) and the proportions of variance for the eigenvectors (line). D A plot of data weighting space that shows the pseudo-eigenvalues space of all data sets indicating how much variance of an eigenvalue is contributed by each data set. The treatment codes used are: T1—Rhodotorula paludigena Y1 + 100% recommend dose of chemical fertilizers (RDCFs), T2—Pseudozyma sp. Y71 + 100% RDCFs, T3—Cryptococcus sp. Y72 + 100% RDCFs, T4—Yeast consortium (Rhodotorula paludigena Y1, Pseudozyma sp. Y71 and Cryptococcus sp. Y72) + 100% RDCFs, T5—100% RDCFs, T6—Rhodotorula paludigena Y1 + 75% RDCFs, T7—Pseudozyma sp. Y71 + 75% RDCFs, T8—Cryptococcus sp. Y72 + 75% RDCFs, T9—Yeast consortium (Rhodotorula paludigena Y1, Pseudozyma sp. Y71 and Cryptococcus sp. Y72) + 75% RDCFs, T10—75% RDCFs, and TC – Control. The data set abbreviations PBT1, PBT2, and PBT3 are plant biochemical traits; PPT1, PPT2, and PPT3 are plant phenotypic traits; MP1, MP2, and MP3 are microbial population, and YP are yield parameters

