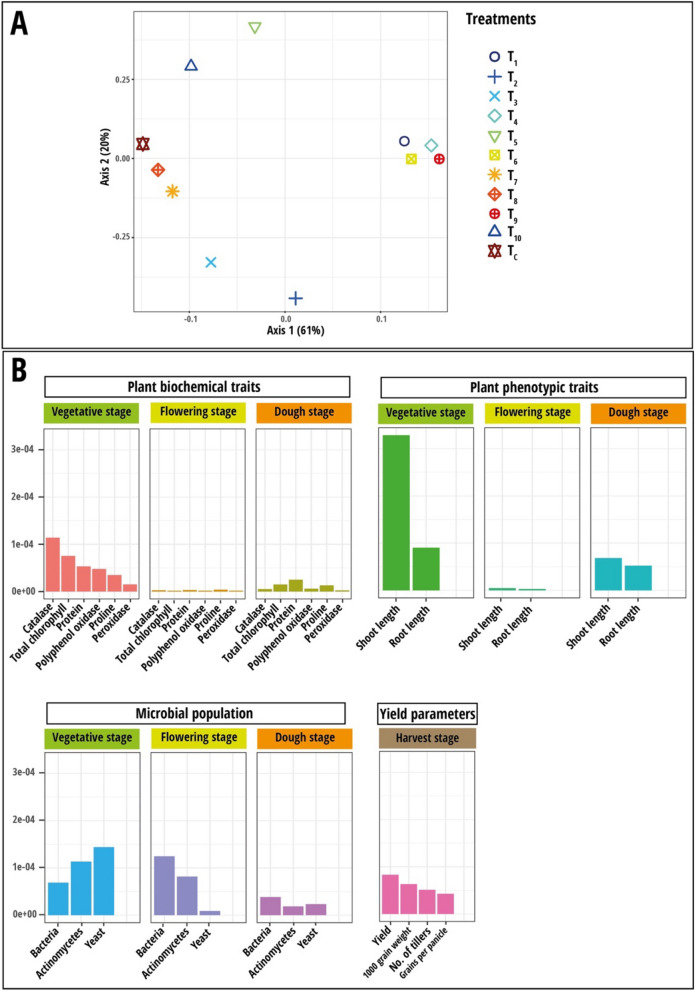
Fig. 7.
A Results of multiple kernel learning analysis (MKL). A Plot of kernel principal component analysis (KPCA) based on nine data sets (Plant biochemical traits, plant phenotypic traits and microbial population measured during stem elongation, flowering, and dough stages). B Plot for important variables in each dataset assessed using Crone-Crosby distance. The treatment codes used are: T1—Rhodotorula paludigena Y1 + 100% recommend dose of chemical fertilizers (RDCFs), T2—Pseudozyma sp. Y71 + 100% RDCFs, T3—Cryptococcus sp. Y72 + 100% RDCFs, T4—Yeast consortium (R. paludigena Y1, Pseudozyma sp. Y71 and Cryptococcus sp. Y72) + 100% RDCFs, T5—100% RDCFs, T6 – R. paludigena Y1 + 75% RDCFs, T7—Pseudozyma sp. Y71 + 75% RDCFs, T8—Cryptococcus sp. Y72 + 75% RDCFs, T9—Yeast consortium (Rhodotorula paludigena Y1, Pseudozyma sp. Y71 and Cryptococcus sp. Y72) + 75% RDCFs, T10—75% RDCFs, and TC – Control

