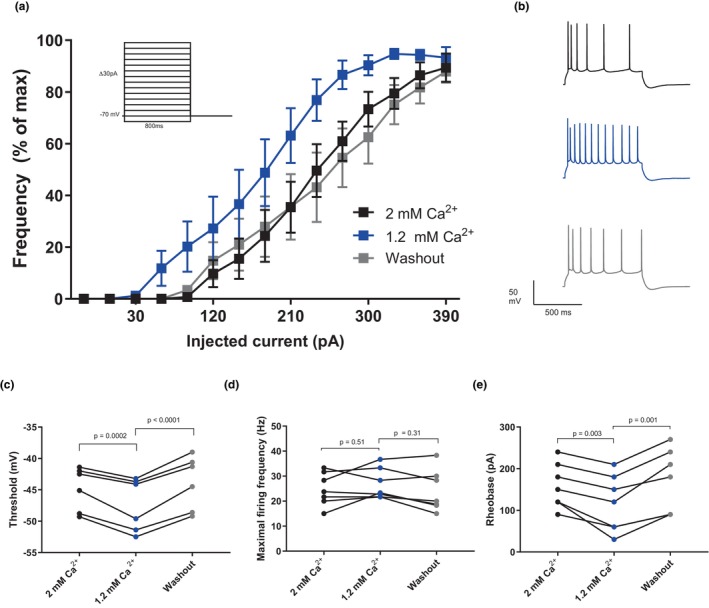
FIGURE 2.

Intracellular G‐protein block has no effect on extracellular calcium‐dependent excitability changes in CA1 pyramidal neurons. (a) An input–output curve showing a left shift in physiological calcium (1.2 mM, blue) compared to high calcium (2 mM, black) and washout (2 mM calcium, gray) (n = 7 slices). Inset shows the stimulation (stepwise current injections increasing by 30 pA from −30 to 390 pA). The data from each cell are normalized to its maximal firing frequency. (b) Example traces from A, injected current is 300 pA. (c) Graph summarizing the effect on the action potential threshold as a result of decreasing the extracellular calcium concentration from 2 to 1.2 mM (Repeated measures one‐way ANOVA with Tukey's multiple comparisons test, F = 42.0, df (total) = 17, p < 0.0001, n = 7 slices). (d) Graph summarizing the effect on the maximal firing frequency as a result of decreasing the extracellular calcium concentration from 2 to 1.2 mM (Repeated measures one‐way ANOVA with Tukey's multiple comparisons test, F = 1.28, df (total) = 20, p = 0.32, n = 7 slices). (e) Graph summarizing the effect on the rheobase as a result of decreasing the extracellular calcium concentration from 2 to 1.2 mM (Repeated measures one‐way ANOVA with Tukey's multiple comparisons test, F = 14.6, df (total) = 20, p = 0.0006, n = 7 slices).
