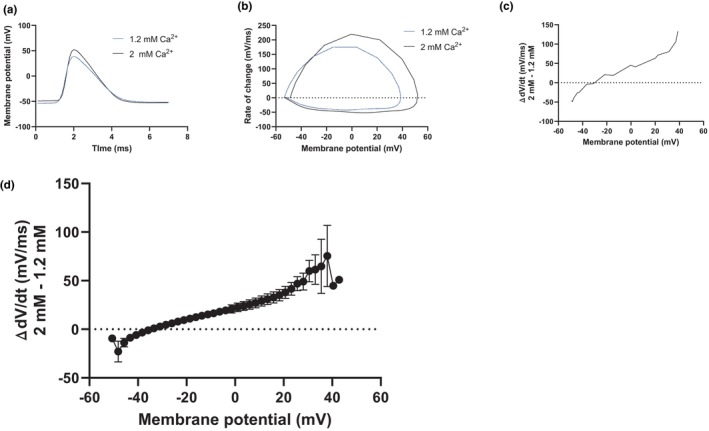
FIGURE 6.

Changes in the extracellular calcium concentration shift the current during the action potential. (a) Example traces of spontaneous action potentials in 2 mM (black) and 1.2 mM (blue) extracellular calcium. (b) Phase‐plane plots of the action potentials shown in (a). (c) Subtraction of the phase‐plane plots shown in (b) showing the difference in dV/dt between 1.2 and 2 mM calcium (rate in 2 mM subtracted from rate in 1.2 mM). (d) Average difference in dV/dt between 1.2 and 2 mM calcium (n = 6 slices, rate in 2 mM subtracted from rate in 1.2 mM).
