FIGURE 2.

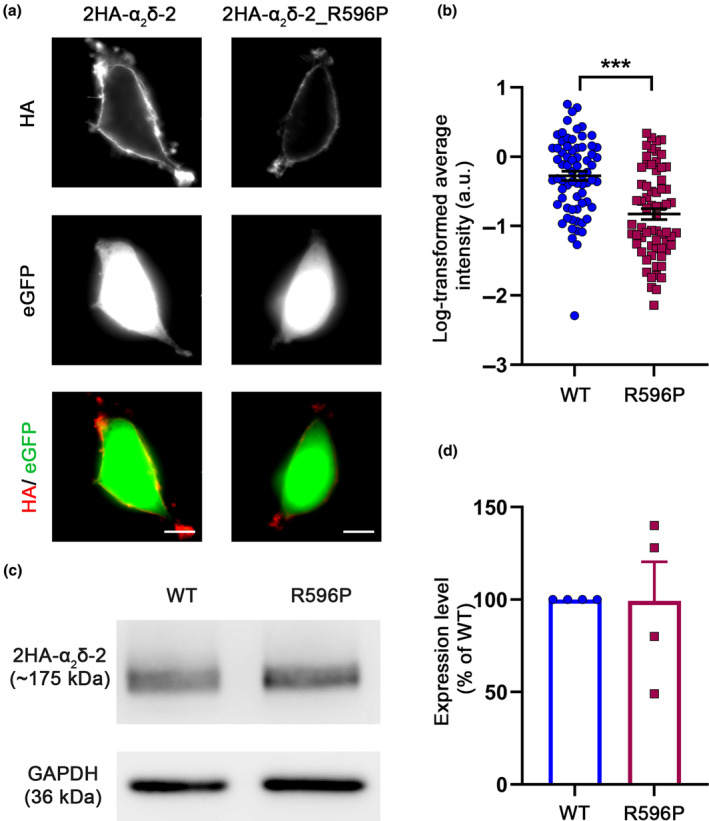
Reduced membrane expression of α2δ‐2_R596P compared to WT α2δ‐2 in tsA201 cells. tsA201 cells were transfected with soluble eGFP together with either HA‐tagged WT or mutated α2δ‐2 (R596P) and were live‐cell labeled with an antibody against the HA epitope. (a) Representative images of anti‐HA live‐cell‐labeled tsA201 cells transfected with 2HA‐α2δ‐2 or 2HA‐α2δ‐2_R596P. Membrane expression of HA‐tagged WT α2δ‐2 is identified by a fine‐dotted pattern along the surface of tsA201 cells. In contrast, dots of 2HA‐α2δ‐2_R596P labeling are sparsely localized on the cell surface, and overall fluorescence intensity is lower. (b) Quantification of α2δ‐2 surface expression. Log‐transformed anti‐HA live‐cell‐staining intensities (arbitrary units) are shown for individual cells (dots) and means ± SEM (lines). Data were obtained from three independent experiments and 69 and 66 cells transfected with WT or mutated HA‐tagged α2δ‐2 were analyzed, respectively. (c) Immunoblot of whole‐cell lysates obtained from tsA201 cells transfected with 2HA‐tagged WT or mutated α2δ‐2. α2δ‐2 protein was detected with an anti‐HA antibody (upper panel), and anti‐GAPDH labeling was used as loading control (lower panel). (d) Quantification of the total protein expression levels of WT and mutated α2δ‐2. Relative total protein expression levels of 2HA‐tagged α2δ‐2_R596P were normalized to WT 2HA‐tagged α2δ‐2 expression levels for each individual experiment (culture preparation). Data were obtained from four independent cell transfections, and values of individual experiments (dots) and mean bars ± SEM (lines) are shown. Statistics: (b) unpaired two‐tailed t‐test, t (133) = 5.4; ***p < 0.0001; (d) unpaired two‐tailed t‐test performed on raw data, t (6) = 0.42; p = 0.69. Scale bars, 10 μm.
