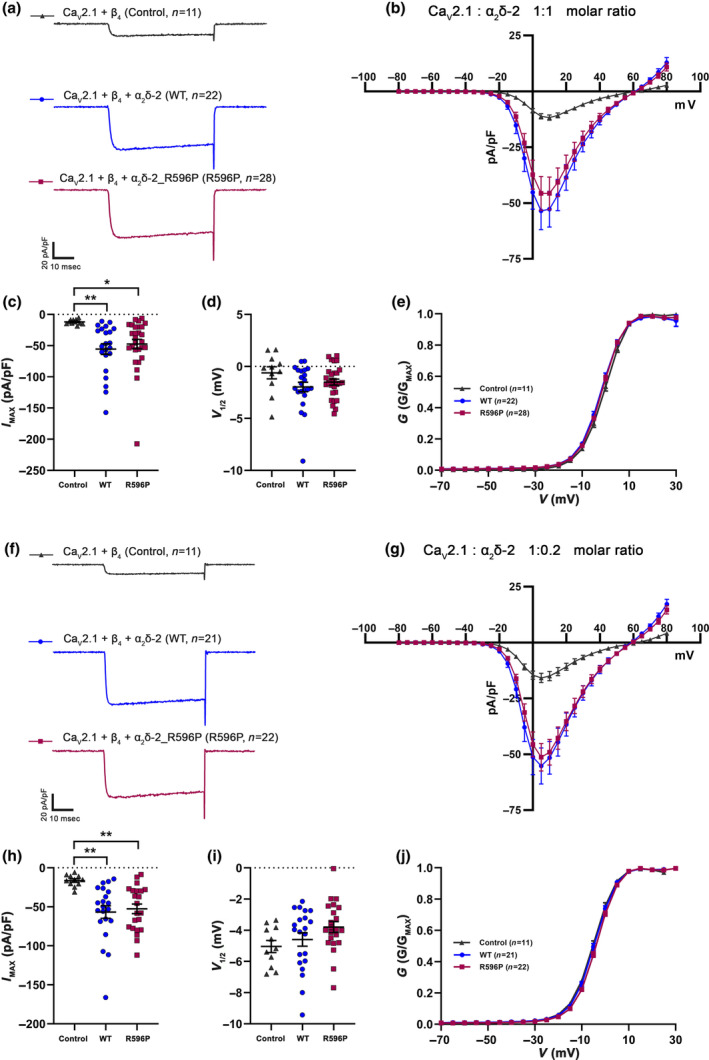
FIGURE 4.

The p.R596P mutation does not compromise the current properties of the P/Q‐type channel CaV2.1. (a–j) Current properties of CaV2.1 recorded from tsA201 cells transfected with CaV2.1 and β4 alone as a control (control, gray triangles), together with WT (WT, blue circles), or mutated α2δ‐2 (R596P, pink rectangles). (a–e) Recordings obtained from tsA201 cells transfected with the three subunits CaV2.1/β4/α2δ‐2 in a molar ratio of 1:1:1, while (f–j) are recordings obtained from tsA201 cells transfected with the three subunits in a molar ratio of 1:1:0.2. Fifty msec test pulses from a holding potential of −80 mV to +80 mV were applied in 5 mV increments. (a, f) Representative whole‐cell Ca2+ current traces at VMAX. Current–voltage relationships (b, g), mean peak current densities (c, h), and mean half‐maximal activation potentials (d, i). Statistics: (c, d) One‐way ANOVA with Tukey's multiple‐comparison test was performed on 11–28 recordings per condition obtained from three independent experiments. (c) Maximal current density, F (2,58) = 5.5; p = 0.0067. P‐values of the post hoc test for the respective comparisons: P = 0.01 for control versus WT, p = 0.02 for control versus R596P, and p = 0.72 for WT versus R596P. (d) Half‐maximal activation potential, F (2,58) = 2.0; p = 0.15. P‐values of the post hoc test for the respective comparisons: P = 0.12 for control versus WT, p = 0.37 for control versus R596P, and p = 0.65 for WT versus R596P. (h, i) One‐way ANOVA with Tukey's multiple‐comparison test was performed on 11–22 recordings per condition obtained from three independent experiments. (h) Maximal current density, F (2,51) = 7.4; p = 0.0016. P‐values of the post hoc test for the respective comparisons: P = 0.002 for control versus WT, p = 0.005 for control versus R596P, and p = 0.89 for WT versus R596P. (i) Half‐maximal activation potential, F (2,51) = 2.2; p = 0.117. P‐values of the post hoc test for the respective comparisons: P = 0.76 for control versus WT, p = 0.13 for control versus R596P, and p = 0.29 for WT versus R596P. Significances of post hoc tests between conditions are indicated in the graphs by asterisks (**p < 0.01, *p = 0.02).
