FIGURE 10.

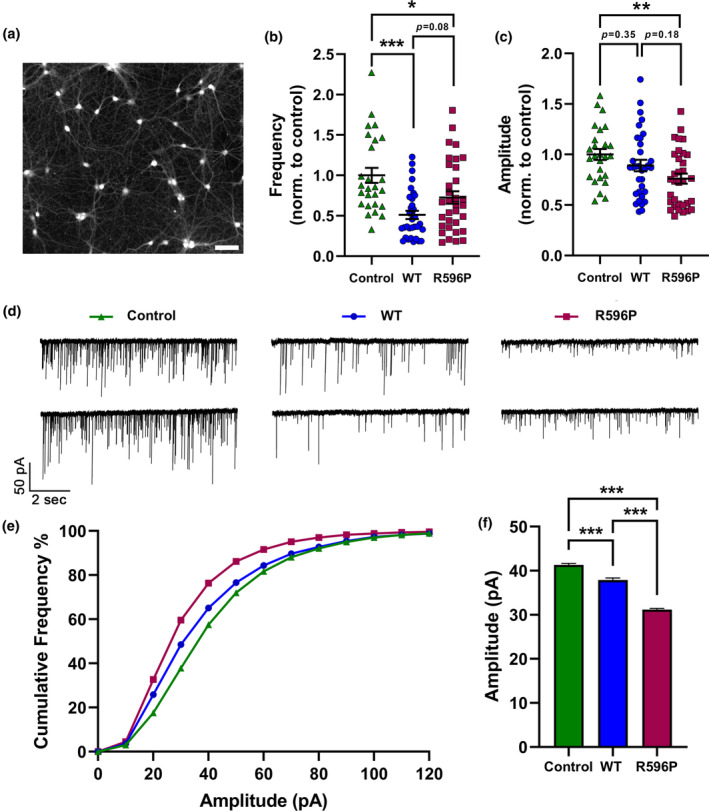
Homologous expression of α2δ‐2_R596P resulted in a greater reduction in spontaneous glutamate‐mediated synaptic transmission. Recordings of mEPSCs in 14–15 DIV cultured hippocampal neurons expressing soluble eGFP alone (control, green triangles), and either WT (WT, blue circles) or mutated (R596P, pink rectangles) α2δ‐2_ΔE23. (a) Representative image of hippocampal neurons at DIV 15 infected with α2δ‐2_R596P showing a ~ 100% infection efficiency. Scale bar, 200 μm. Quantification of mEPSC frequencies (b) and average amplitudes (c). Amplitudes and frequencies of mEPSCs were normalized to the mean value of control condition for each individual experiment. (d) Two representative traces of mEPSCs from independent recordings for all three conditions. (e) Cumulative frequency distribution histograms of all mEPSC amplitudes recorded from neurons shown in the previous panels. Number of analyzed events per condition: Control, n = 6012; WT, n = 3374; R596P, n = 5384. (f) Comparison of mean mEPSC amplitudes of all recorded events. Expression of the R596P mutant was associated with larger reduction in mEPSC amplitude compared to WT α2δ‐2. Statistics: (b, c) One‐way ANOVA with Tukey's multiple‐comparison test was performed on 26–33 recordings per condition from three independent culture preparations. (b) Frequency: F (2,89) = 10.5; p < 0.0001. P‐values of the post hoc test for the respective pairwise comparisons: P < 0.001 for control versus WT, p = 0.03 for control versus R596P, and p = 0.08 for WT versus R596P. (c) Amplitude: F (2,89) = 4.7; p = 0.01. P‐values of the post hoc test for the respective pairwise comparisons: P = 0.35 for control versus WT, p = 0.008 for control versus R596P, and p = 0.18 for WT versus R596P (f) One‐way ANOVA with Tukey's multiple‐comparison test was performed on 3374–6012 mEPSC events, F (2,14767) = 273.6, p < 0.0001. P‐values of the post hoc test for the respective pairwise comparisons: P < 0.0001 for control versus WT, control versus R596P, and WT versus R596P. Significances of post hoc tests between conditions are indicated in the graphs by asterisks (***p < 0.001, **p < 0.01, *p = 0.031).
