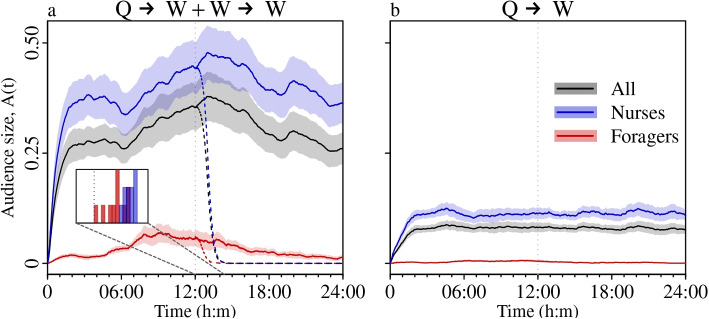
Fig. 3.
Indirect transmission enhances queen pheromone spreading, and nurses are more exposed than foragers. Growth curves show the proportion of informed bees as a function of time for daily contact sequences including both direct and indirect transmission (a, ), or in the absence of indirect transmission (b, direct transmission only, ). Lines and shaded areas show the cross-colony grand means and standard errors, respectively. Each colony contributes a single value to the mean (n=10). Dashed coloured lines indicate the decay in the proportion of informed workers after the simulated removal of the queen at 12:00. The histograms in panel (a) show the post queen removal half-life distributions for informed nurses (blue) and foragers (red)

