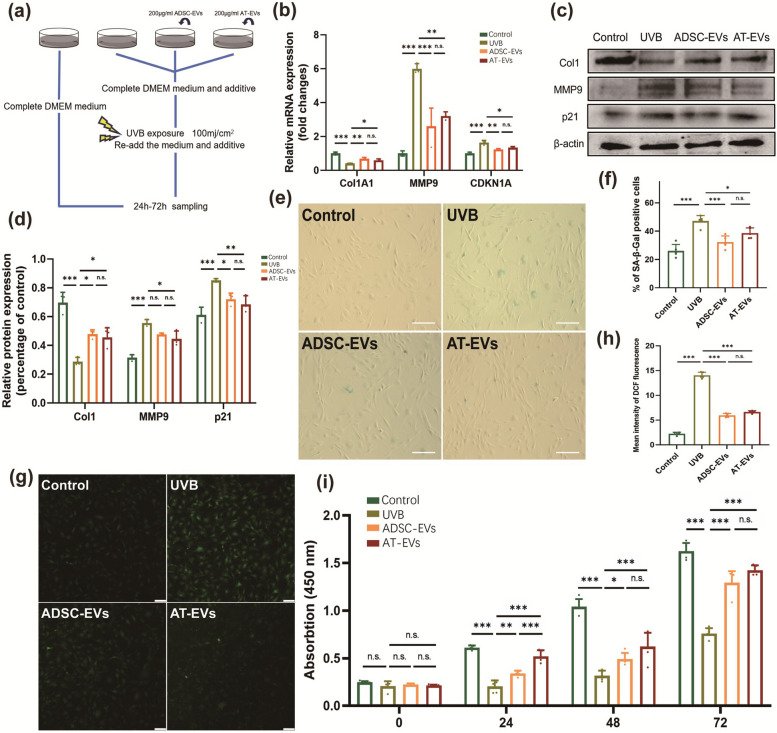
Fig. 3.
AT-EVs can protect fibroblasts during UVB irradiation. a Schematic diagram of the process of cell intervention and UVB irradiation. b The mRNA expression of Col1A1, MMP9, and CDKN1A in the four groups. c, d The protein expression of Col1, MMP9, and p21 in the four groups. e SA-β-gal staining revealed differences in FB senescence among the four groups. Scale bars = 100 μm. f Quantification of SA-β-gal-positive cells in the four groups. g The fluorescence intensity reflects the level of intracellular ROS production after intervention and UVB irradiation. Scale bars = 50 μm. h Quantification of the level of ROS production in the four groups. i CCK-8 analysis of NIH3T3 cell proliferation in the four groups after 72 h (n = 5). *p < 0.05, **p < 0.01, ***p < 0.001, n.s., no significant difference between groups

