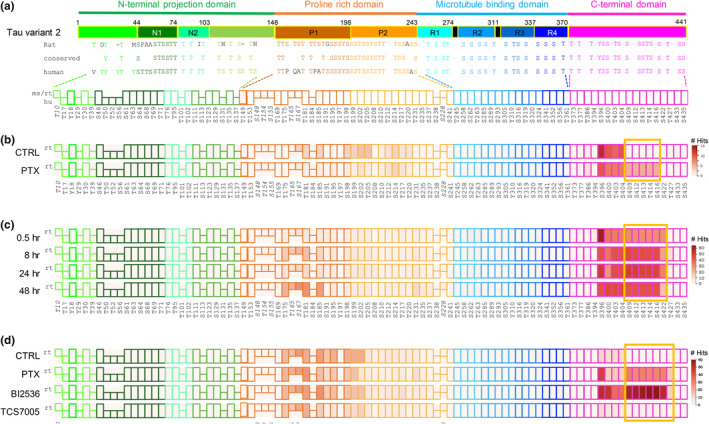
FIGURE 1.

Tau phosphorylation during hyperexcitation. (a) Top, tau domain structure is depicted schematically with amino acid numbering at domain boundaries. Domains and subdomains are color coded as shown. Black bars represent PHF6* and PHF6 motifs. Middle, all 85 serine (S), threonine (t), and tyrosine (Y) residues in tau are shown in the approximate domain locations for mouse MAPT isoform a, 430aa (NP_001033698.1) (identical to rat) and human MAPT variant 2, 441aa (NP_005901). Conserved sites are displayed in between the rodent and human sequences. Bottom, schematic of phosphomap. Each phosphomap is a line of colored boxes representing all possible tau phosphorylation sites. Tau domains are color coded as shown at top. Sites conserved between rodent and human are depicted as rectangles. Phosphoresidues unique to rodent (ms/rt) or human (hu) tau are represented as squares on upper or lower rows, respectively. Numbering at bottom refers to the human MAPT 441 aa isoform, except italicized numbers which denote sites in mouse sequence not found in human tau; for these sites the mouse numbering is given. (b–d) Phosphomapping of tau phosphorylation with hyperexcitation. Following stimulation, tau was immunopurified and MS performed. Phosphorylation cluster induced by PTX condition (hyperexcitation) is highlighted with yellow box. Legend at right indicates number of peptide hits at that site. (b) Primary rat hippocampal neurons were stimulated with 100 μM PTX for 24 h or vehicle control (CTRL) as indicated. Phosphomap represents one MS run consisting of two rat cultures. (c) Time course of PTX administration. Primary rat hippocampal neurons were stimulated with 100 μM PTX for 30 min, 8 h, 24 h, and 48 h or with vehicle control as indicated. Phosphomap represents one MS run consisting of four rat cultures. (d) Plk2 inhibitor blocks hyperexcitation‐induced C‐terminal phosphorylation. Primary rat hippocampal neurons were treated with 100 μM PTX for 24 h or with vehicle control as indicated. During the final 4 h of PTX administration, 50 nM BI‐6727 or 50 nM TC‐S7005 were applied. Phosphomap represents one MS run consisting of four rat cultures.
