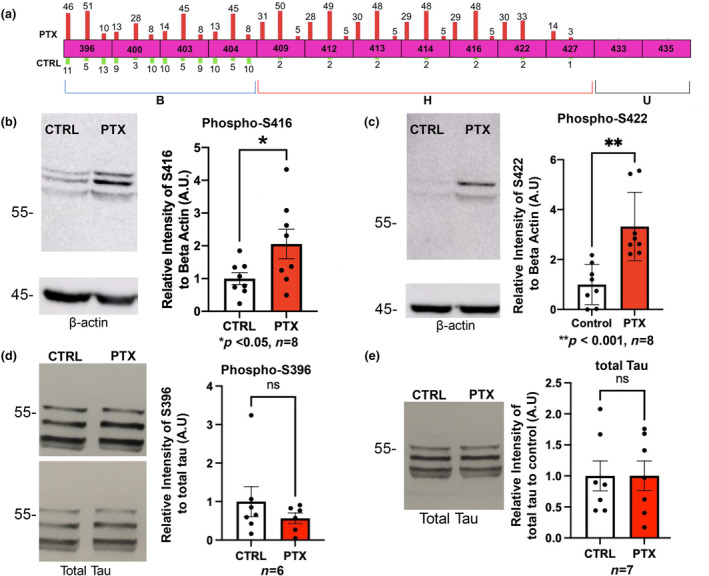
FIGURE 2.

Replication and validation of MS findings at selected sites. (a) Top, MS was performed in triplicate and number of phosphopeptide hits per run are shown as bars on each residue. No number is shown if zero hits were obtained in that run. Hits obtained with PTX treatment are shown as red bars above the sites (scaled in height to the number of hits), and those observed in control condition are green bars below each site. Each PTX bar is paired with its cognate control bar beneath. Bottom, C‐terminus is divided into 3 phosphosite subdomains: B, basally phosphorylated (aa396‐404); H, hyperexcitation inducible (aa409‐427); and U, unmodified (aa433‐435) regions. (b–e) Primary rat hippocampal neurons were stimulated with 100 μM PTX for 24 h or vehicle control as indicated. Cells were collected and immunoblotted for phospho‐S416 (ROUT outlier test (Q = 1%)). D'Afostino and Pearson test (alpha = 0.05) was used to test for normality and passed; t‐test used (p = 0.0469, t = 2.179, df = 14) (b), phospho‐S422 (ROUT outlier test (Q = 1%)). D'Afostino and Pearson test (alpha = 0.05) was used to test for normality and did not pass; Mann–Whitney test used (p = 0.0007). (c), phospho‐S396 (ROUT outlier test (Q = 1%)). D'Afostino and Pearson test (alpha = 0.05) was used to test for normality and did not pass; Mann–Whitney test used (p = 0.5338) (d), and total tau (ROUT outlier test (Q = 1%)). D'Afostino and Pearson test (alpha = 0.05) was used to test for normality and did not pass; Mann–Whitney test used (p > 0.9999) (e). Quantifications are shown to the right of panels and represent relative intensity to the control. Loading controls were beta‐Actin (b, c) and total tau (d). For (e) the loading was controlled by quantified protein amount. n = 6–8 independent cell culture preparations as indicated below each graph.
