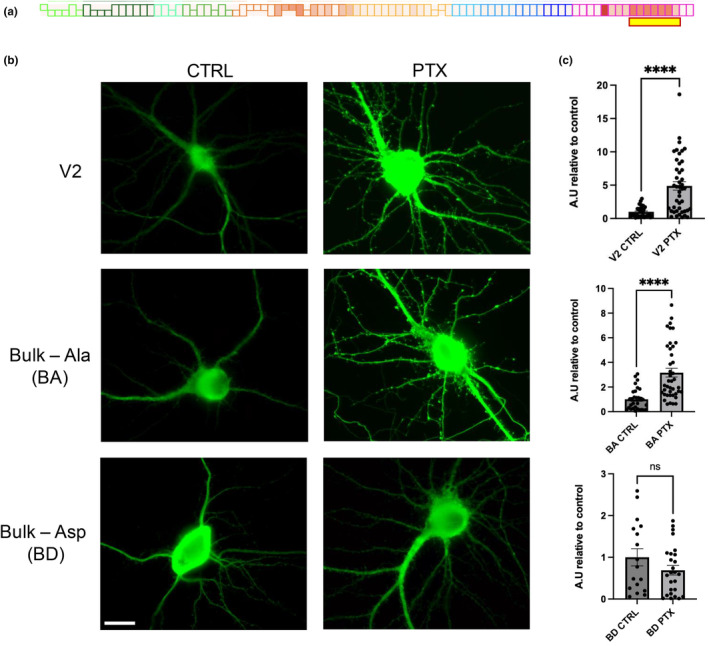
FIGURE 3.

Effects of C‐terminal phosphosite mutations on tau localization in secondary dendrites. (a) Schematic of the hyperexcitation‐responsive amino acid residues used for mutagenesis (highlighted with yellow box underneath representative PTX stimulation phosphomap). (b) Hippocampal neuron localization and expression of Flag‐tau control and mutant constructs as indicated left, treated with vehicle (CTRL) or PTX as indicated on top. Green, Flag tag antibody. (c) Quantification of Flag intensity in secondary dendrites from (b); n = 14–43 neurons, from at least 6 separate coverslip plantings of 2 independent culture groups. Data are means ± SEM. ****p < 0.0001, ns = not significant; ROUT outlier test (Q = 1%). D'Afostino and Pearson test (alpha = 0.05) was used to test for normality. V2 did not pass normality, therefore Mann–Whitney test used (p < 0.0001). BA and BD passed normality (BA ctrl, BA ptx, BD ctrl, BD ptx, p = 0.0959, 0.0641, 0.2911, and 0.2908, respectively). Two‐tailed Student's t‐test used for BA (p < 0.0001, t = 4.968, df = 69) and BD (p = 0.1623, t = 1.423, df = 41). Scale bar represents 20 μm.
