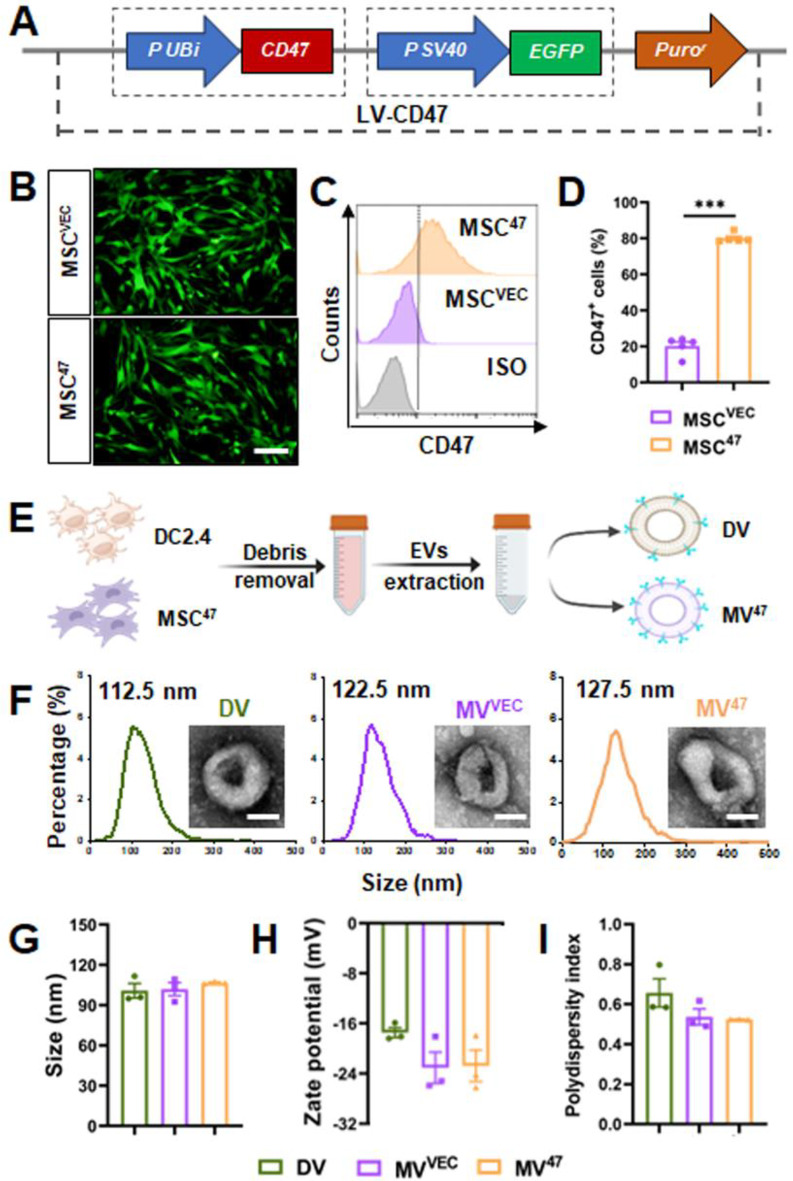
Fig. 1.
Characterization and identification of designed EVs. (A) Schematic of CD47-overexpressing lentiviral construct. (B) Cytosolic EGFP fluorescence observed under inverted fluorescence microscopy. Scale bar = 100 μm. (C&D) Flow cytometric histograms and quantification for CD47 expression (n = 5). (E) Schematic diagram of EV extraction. (F) EV morphology and size distribution were examined using transmission electron microscopy (TEM) and nanoparticle tracking analysis (NTA), respectively. Scale bar = 50 nm. (G-I) Size distribution, zeta potential, and polydispersity index (PDI) were determined by dynamic light scattering. Statistical evaluations were conducted using a two-tailed unpaired Student’s t-test. Results were presented as mean ± SEM (*** P < 0.001)

