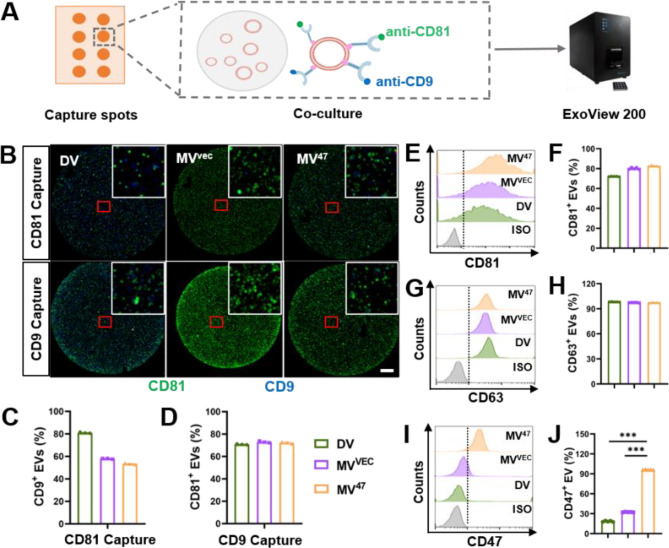
Fig. 2.
Expression of CD47 and common markers on EV Surfaces. (A) Schematic diagram depicting ExoView 200-based EV biological characterization. (B) Representative images demonstrating co-localization of CD81 and CD9 on individual EVs. An enlarged image is displayed in the top right corner to highlight details. Scale bar = 20 μm. (C&D) Quantification of CD9+ and CD81+ EVs from CD81 or CD9 capture spots. (E-J) Aldehyde/sulfate latex beads-based flow cytometric histograms detail CD81, CD63, and CD47 expression on individual EVs (n = 5). Statistical evaluations were conducted using one-way ANOVA. Results were presented as mean ± SEM (*** P < 0.001)

