Fig. 5.
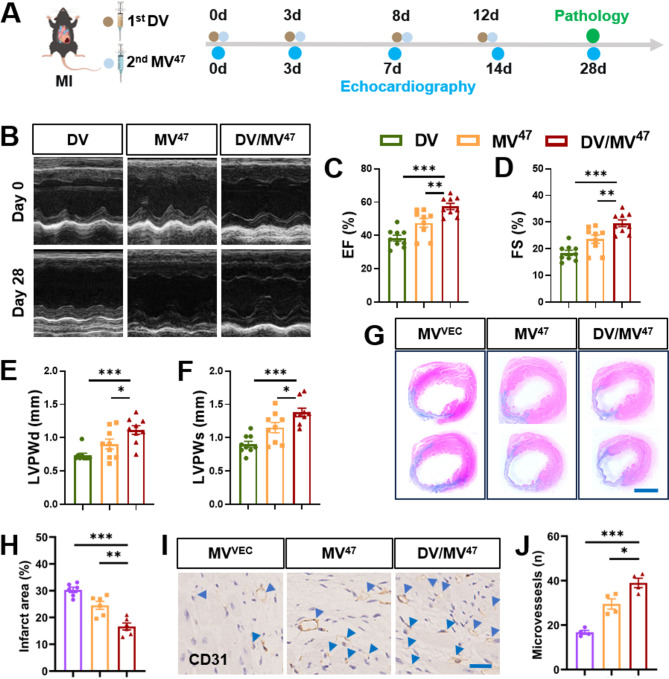
Mitigation of post-MI cardiac remodeling by “Engage & Evasion” approach. (A) Schematic experimental design. (B) M-mode echocardiographic images captured on Days 28 post-MI. (C-F) Bar charts for cardiac function and structure, including metrics such as left ventricular ejection fraction (EF) and fractional shortening (FS), as well as systolic (LVPWs) and diastolic (LVPWd) posterior wall thicknesses (n = 9). (G&H) Masson’s trichrome staining and quantification (n = 6). Scale bar = 2 mm. (I&J) Representative IHC staining for CD31 and corresponding quantification (n = 4). Blue arrowheads highlight CD31+ capillaries. Scale bar = 25 μm. Statistical evaluations were conducted using either two-way ANOVA or one-way ANOVA. Results were presented as mean ± SEM (* P < 0.05; ** P < 0.01; *** P < 0.001; ns: not significant)

