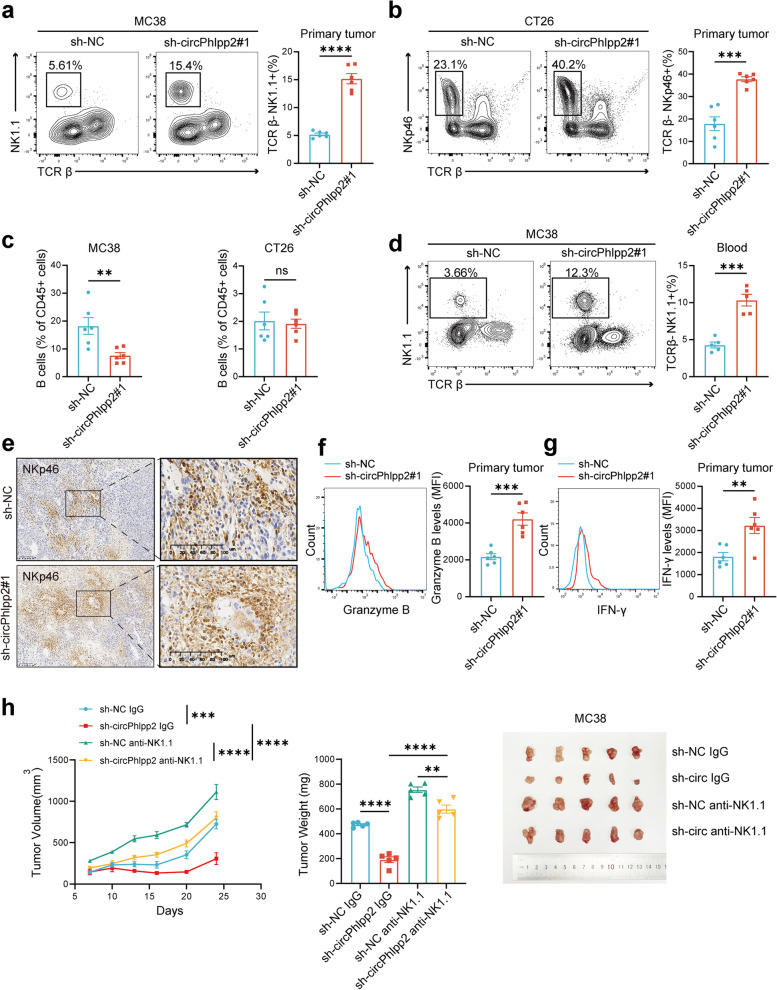
Fig. 3.
circPHLPP2 reduces NK cell proportion and granzyme B and IFN-γ expression. a-b Representative plots (left) and summary data (right) of NK cells in the primary tumors with or without circPhlpp2 knockdown from C57 mice (a) or BALB/c mice (b) as determined by flow cytometry (n = 6). c Frequency of B cells in tumors with or without circPhlpp2 knockdown from C57 mice (left) or BALB/c mice (right) as determined by flow cytometry (n = 6). d Representative plots (left) and summary data (right) of NK cells in blood of C57 mice bearing tumors with or without circPhlpp2 knockdown as determined by flow cytometry (n = 5). e Representative IHC images for NK cells (NKp46+) in tumors with or without circPhlpp2 knockdown from C57 mice, scale bar = 400 μm. f-g Expression levels of granzyme B (f) and IFN-γ (g) of NK cells in tumors with or without circPhlpp2 knockdown from C57 mice (n = 6). i The volume, weight and images of tumor allografts in NK cell-depleted C57 mice versus control C57 mice (n = 5) (left, two-way ANOVA test; middle, one-way ANOVA test). Data in a-d and f-g were calculated by Student’s t test. **P < 0.01, ***P < 0.001, ****P < 0.0001

