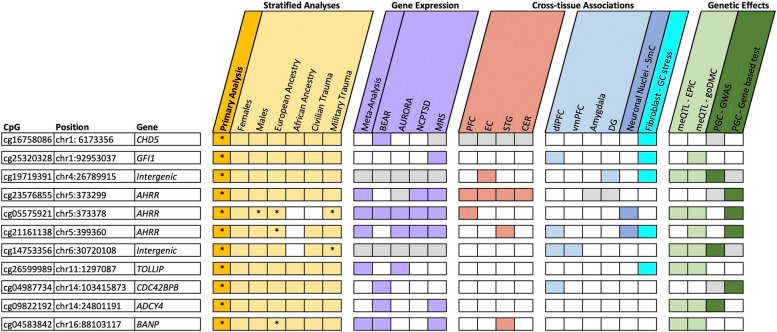
Fig. 2.
Summary of all analyses and findings. The figure combines CpGs from the main analysis (gold) and stratified analyses for sex, ancestry, and trauma type (light gold); and summarizes the results of blood and brain correlations (rose); gene expression (purple); cross-tissue associations for multiple brain regions (light blue), neuronal nuclei (blue), and a fibroblast model of prolonged stress (aqua); and genetic effects, including methylation quantitative trait loci (meQTL) analyses (light green) and genetic associations from the recent PGC-PTSD GWAS (dark green). Positive findings (p < 0.05) are indicated with the specific color of the respective category. Asterisk (*) indicates epigenome-wide significance (p < 9e − 8). Gray represents the CpGs or genes that were not present in the respective datasets. PFC, prefrontal cortex; EC, entorhinal cortex; STG, superior temporal gyrus; CER, cerebellum; dlPFC, dorsolateral prefrontal cortex; vmPFC, ventromedial prefrontal cortex; DG, dentate gyrus; 5mC, 5-methylcytosine; GC, glucocorticoid

