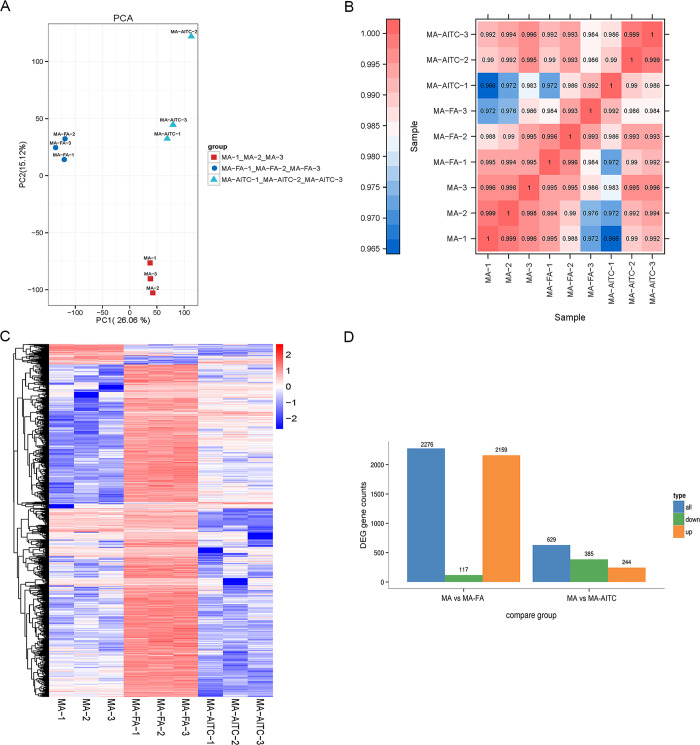
Fig 1. Transcriptome quality validation and differential gene analysis of P. xylostella male antennas (MA).
Quality control metrics for transcriptomes are shown as principal components analysis (PCA) (A), correlation analysis (B), and gene cluster heatmap (C) for the MA, MA-FA, and MA-AITC groups. An overview of differentially expressed genes under different treatments (D). MA, control; MA-FA, female exposed; MA-AITC, AITC exposed.

