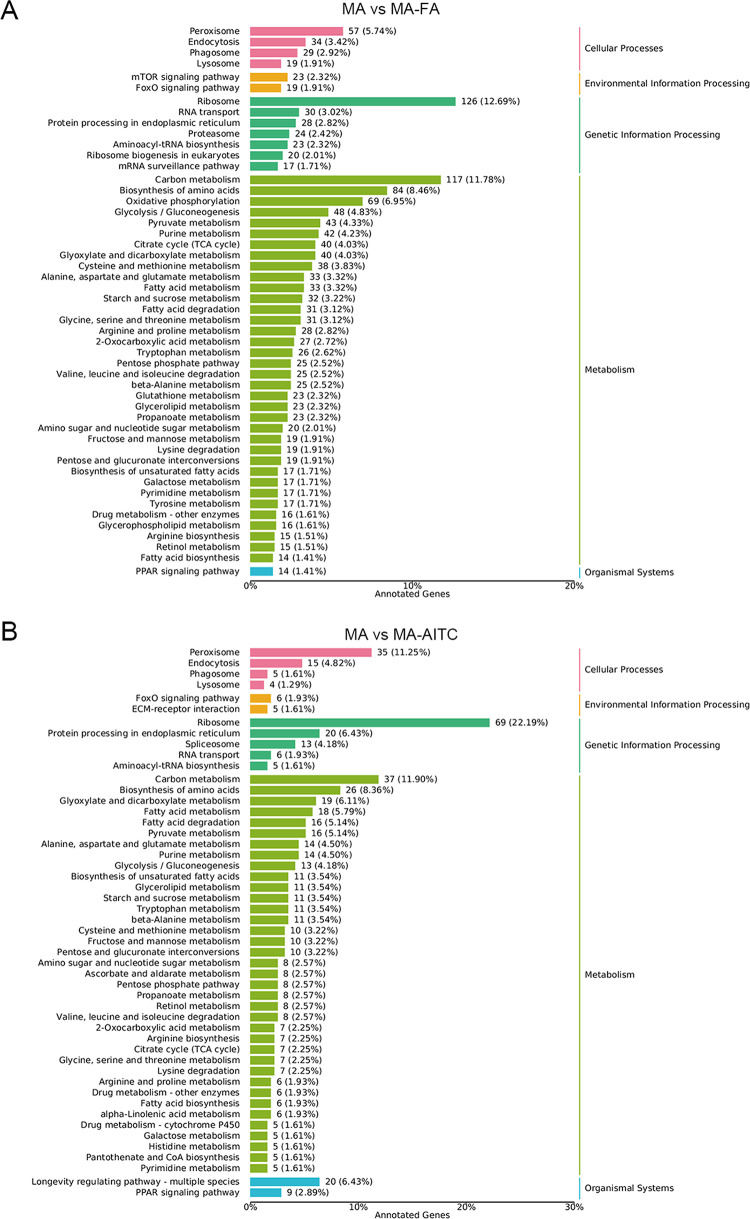
Fig 3.
Kyoto Encyclopedia of Genes and Genomes (KEGG) analysis of differentially expressed genes in MA vs MA-FA (A) and MA vs MA-AITC (B). The left axis shows the annotated KEGG metabolic pathway names and the right axis shows the corresponding primary classification names. The X-axis represents the number of genes from the annotated pathway and their proportion to the total genes annotated.

