
Fig. 2.
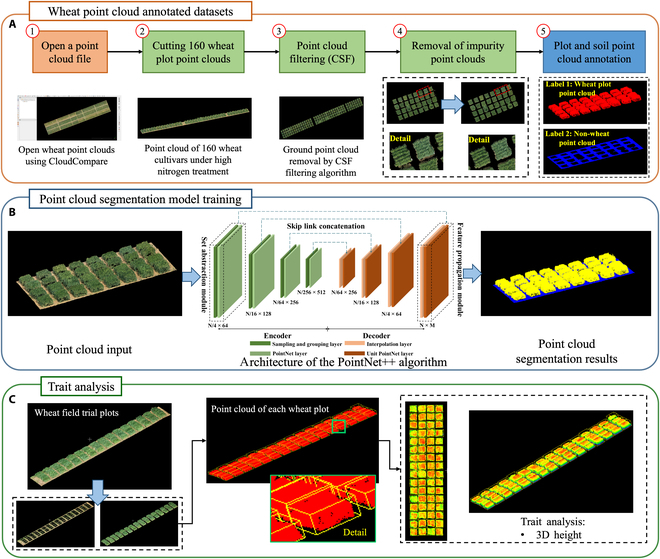
Algorithm steps for processing the 3D point cloud data generated from UAV imagery, including the use of a deep learning 3D point cloud segmentation algorithm to extract different wheat varieties and their 3D plot point clouds combined with a point cloud analysis algorithm to calculate the digitized phenotypic features of each plot point cloud. (A) Combining soil filtering algorithms with manual annotation, the process involves separating soil point clouds from aboveground wheat point clouds. In addition, ground point clouds and plot-specific point clouds are classified and annotated by manually removing impurity point clouds that are unrelated to the ground or wheat. This methodology facilitates the construction of a 3D plot segmentation dataset for field-based wheat analysis. (B) To train the 3D plot segmentation model for field wheat, the Point++ deep learning point cloud segmentation algorithm is used to train the dataset. Upon completion of the segmentation, different categories of point clouds are colored, and .las files are generated for each category. (C) When the trained Point++ model is used to segment point clouds under different nitrogen treatments, processing is limited to 3D point clouds of aboveground wheat plots. For each segmented plot, the outermost enclosing points are calculated, and bounding boxes are drawn, allowing phenotypic traits to be extracted for individual plot point clouds. Using the geographic coordinates on the ground plane, the height of each point within the canopy of the wheat plots is calculated for each bounding box. The average height is then calculated to obtain the 3D height of the plot. CSF, Cloth Simulation Filter.