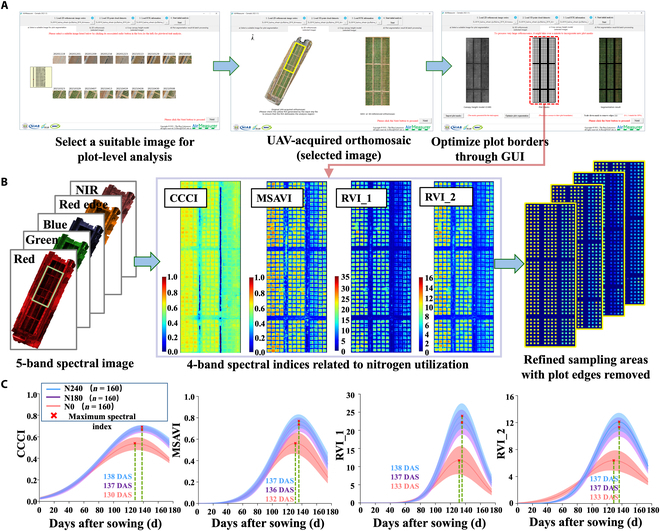
Fig. 5.

Plot masks of UAV RGB images and multispectral images are combined for the dynamic phenotype extraction of vegetation indices (VIs) on the basis of multispectral images. (A) The RGB image mask generation function of AirMeasurer was used to obtain the plot canopy masks of 160 wheat varieties. (B) On the basis of the existing 5-channel stitched spectral images combined with the formula of the VI and the spectral fusion images of the 4 VIs, the mask overlay on the VI image was segmented, and the static VIs of the plot canopy with the removal of marginal effects were obtained. (C) Based on the wheat spectral images of 10 flights, we plotted fitted curves to analyze the changes and error intervals of the 4 VIs under 3 nitrogen treatments and analyzed the different rates of change during the changes in the VIs to extract the dynamic phenotypic traits on the basis of the VIs. NIR, near infrared; GUI, graphical user interface.
