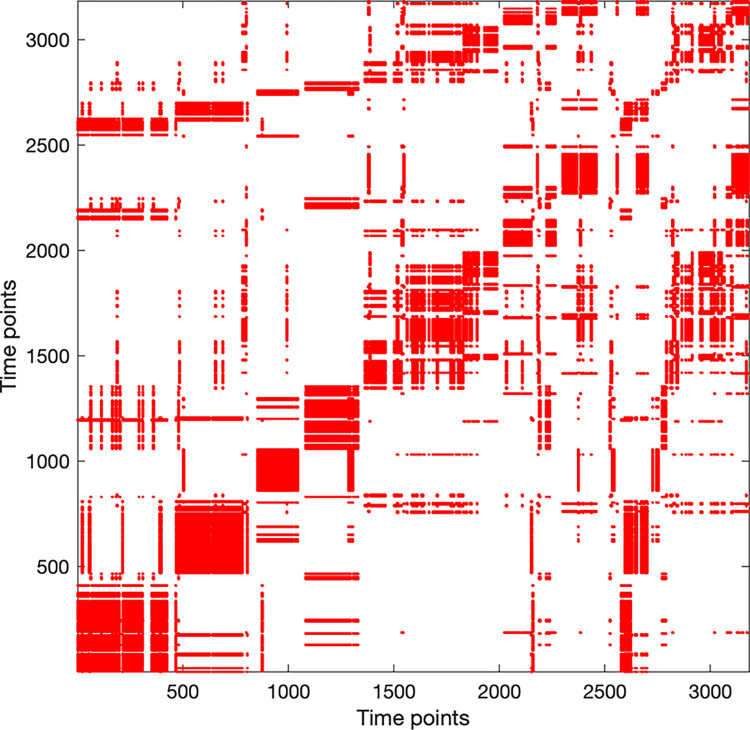
Fig 2. Example of a recurrence plot.
Example of a recurrence plot constructed from nominal time series data of two interacting participants’ gaze towards the 9 task relevant items. The boxes along the diagonal line from the bottom left to the top right indicate moments of prolonged joint attention. Unique for this example dyad, symmetrical converging structures on the top left and bottom right, mirrored across line of coincidence indicate that both participants revisited all items during approximately the last minute of the conversation.

