. 2024 Nov 26;13:e72177. doi: 10.7554/eLife.72177

Figure 3. Dispersal rates (inset) and major trends in geographic ancestries.

Vectors start at sample locations (circles) and point to the mean location of ancestors across 878 loci 104 generations ago. Samples coloured by genomic principle component group (Wlodzimierz et al., 2023).

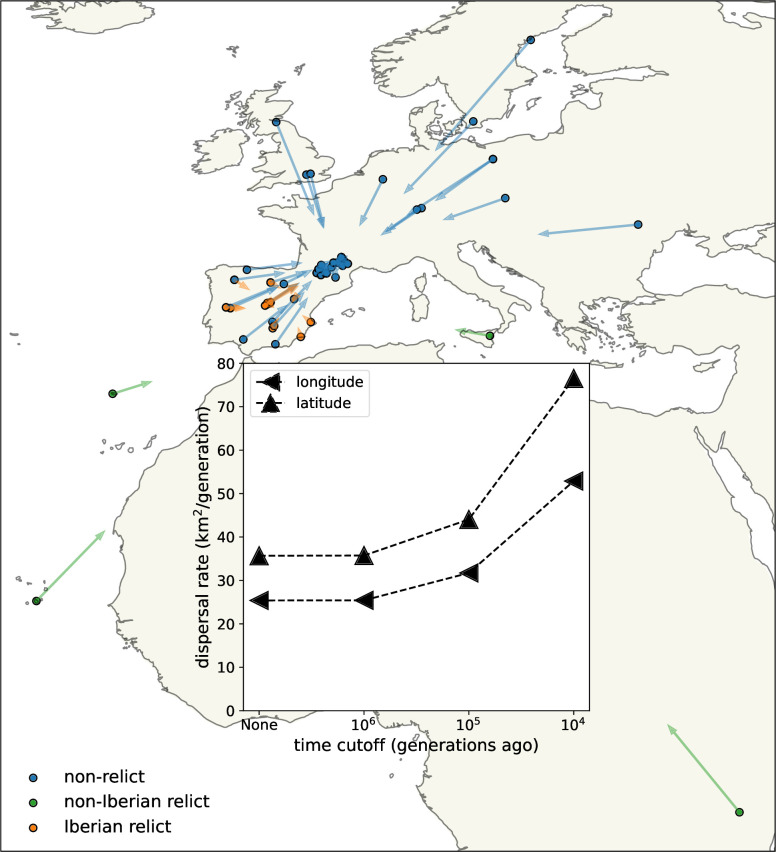
Figure 3.

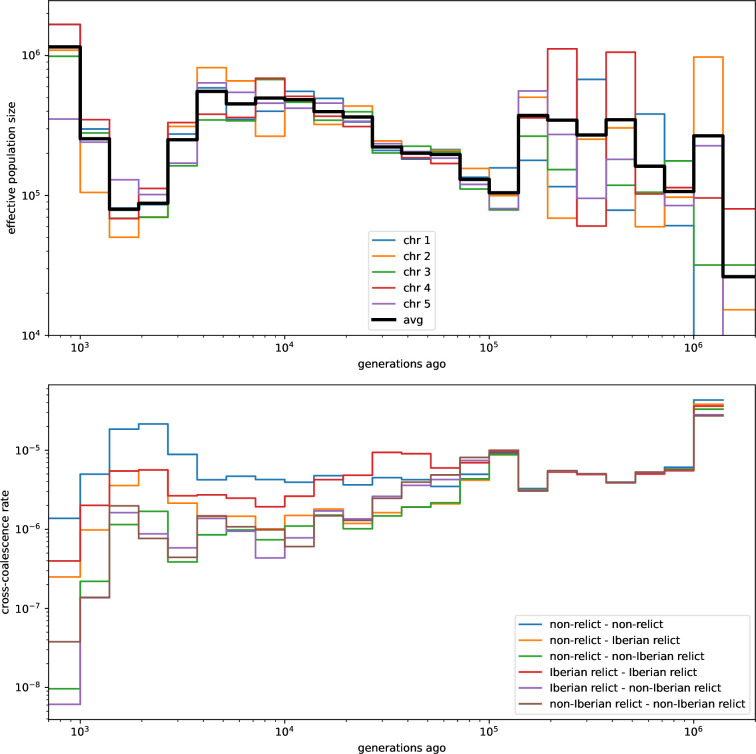
Figure 3—figure supplement 1. Relate-inferred effective population sizes and cross-coalescent rates.

Figure 3—figure supplement 1.

Effective population sizes for each chromosome (top) and cross-coalescence rates for each pair of principle component groups (bottom) inferred with Relate. Compare with Figure 4a in 1001 Genomes Consortium, 2016 and Figures 5 and 6 in Durvasula et al., 2017.