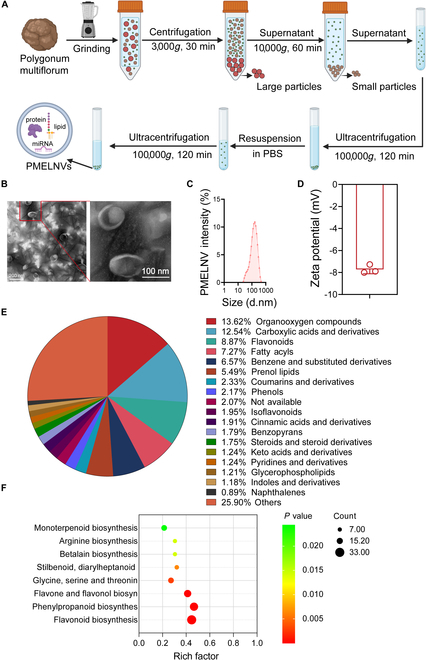
Fig. 1.

Detection and analysis of PMELNVs. (A) Schematic diagram illustrating the process of isolating and purifying PMELNVs. (B) Morphological characteristics and dimensions of PMELNVs following centrifugation using a sucrose gradient density characterized by TEM. Scale bar, 200 nm. (C) Dynamic light scattering analysis of the size distribution of PMELNVs. (D) Zeta potential of PMELNVs. (E) Identification of all compounds present in PMELNVs. (F) Enrichment analysis of KEGG pathways for all compounds present in PMELNVs.
