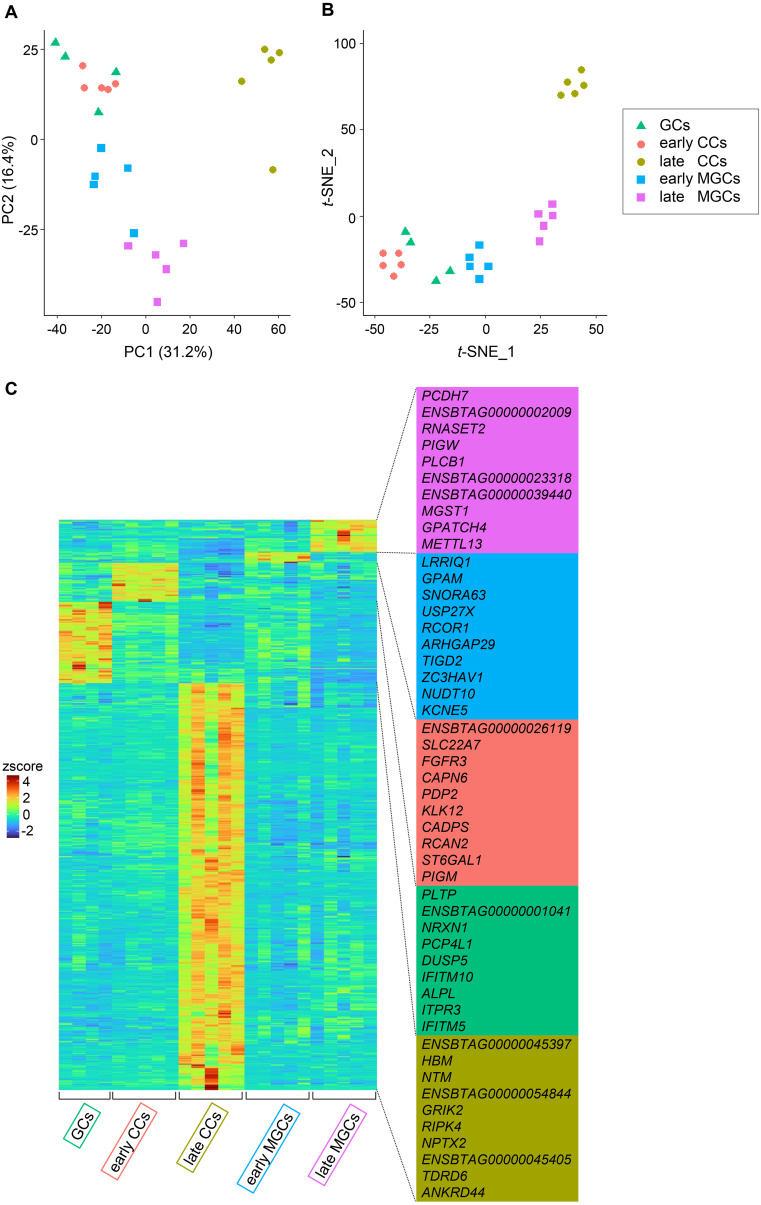
Fig. 4.
PCA plot (A), t-SNE plot (B), and heatmap visualizing marker gene expression (C) using the datasets from bovine GCs, early CCs, late CCs, early MGCs, and late MGCs. Four GCs collected from secondary follicles, and five CCs and five MGCs each collected from early and late antral follicles were analyzed. (C) Top 10 marker genes for each cell type are shown on the right.

