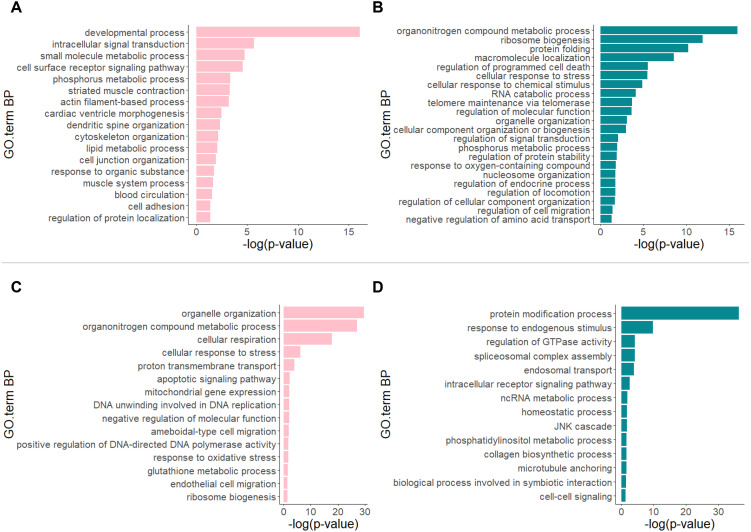
Fig. 5.
Representative GO terms (Biological Process, BP) between the group of GCs, early CCs, and early MGCs (referred to as the “early group”) and late MGCs group (up-regulated (A) and down-regulated (B)), and between the early group and late CCs group (up-regulated (C) and down-regulated (D)). Comparison of the datasets of the early group to those of the late MGCs group revealed up-regulated genes (FDR < 0.05; log2 fold change > 0, n = 1,943) and down-regulated genes (FDR < 0.05; log2 fold change < 0, n = 1,716). Comparison of the datasets of the early group to those of the late CCs group revealed up-regulated genes (FDR < 0.05; log2 fold change > 0, n = 3,833) and down-regulated genes (FDR < 0.05; log2 fold change < 0, n = 4,143).

