
Fig. 4.
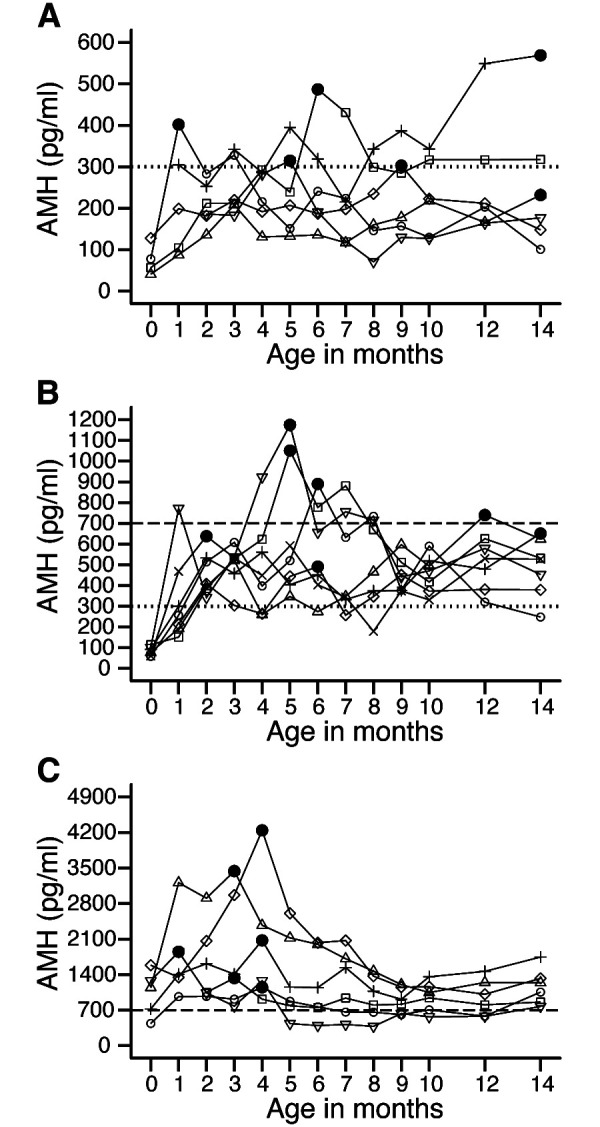
Changes in plasma anti-Müllerian hormone (AMH) concentration during the rearing period in low (A, n = 6), middle (B, n = 7), and high (C, n = 6) AMH groups. The different symbols in each panel indicate individual cows, while filled circles indicate the maximum values for individuals. The dotted and dashed horizontal lines indicate 300 and 700 pg/ml, respectively.