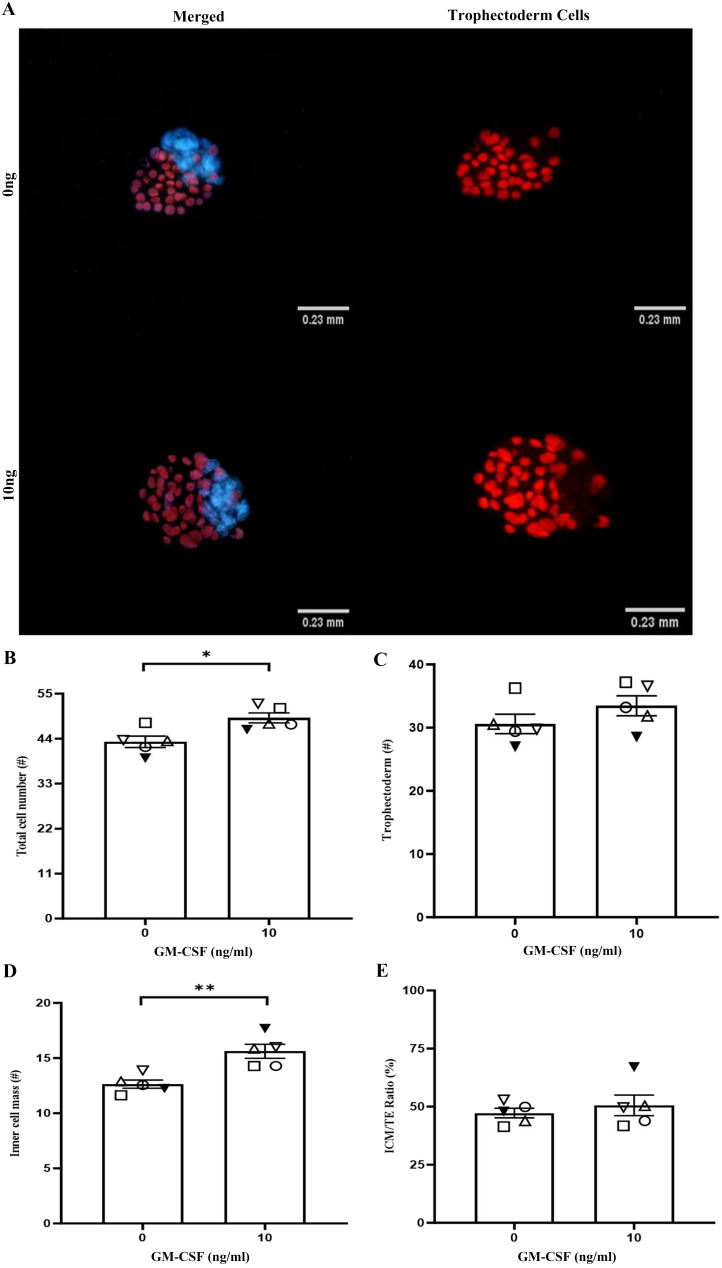
Fig. 3.
The effect of GM-CSF during IVM on blastocysts cell number after 96 h of culture. (A) Representative images of blastocyst cell staining for 0 (control) and 10 ng/ml of GM-CSF. (B) The proportion of total cell number, (C) TE cell number (red), (D) ICM cell number (blue), and (E) ICM/TE ratio. The data is expressed as a percentage of total oocytes and are the mean ± SEM of five replicates with a minimum of 10 blastocysts in each group per replicate. Different symbols represent the mean of each replicate across the treatment groups (* P < 0.05, ** P < 0.01).

