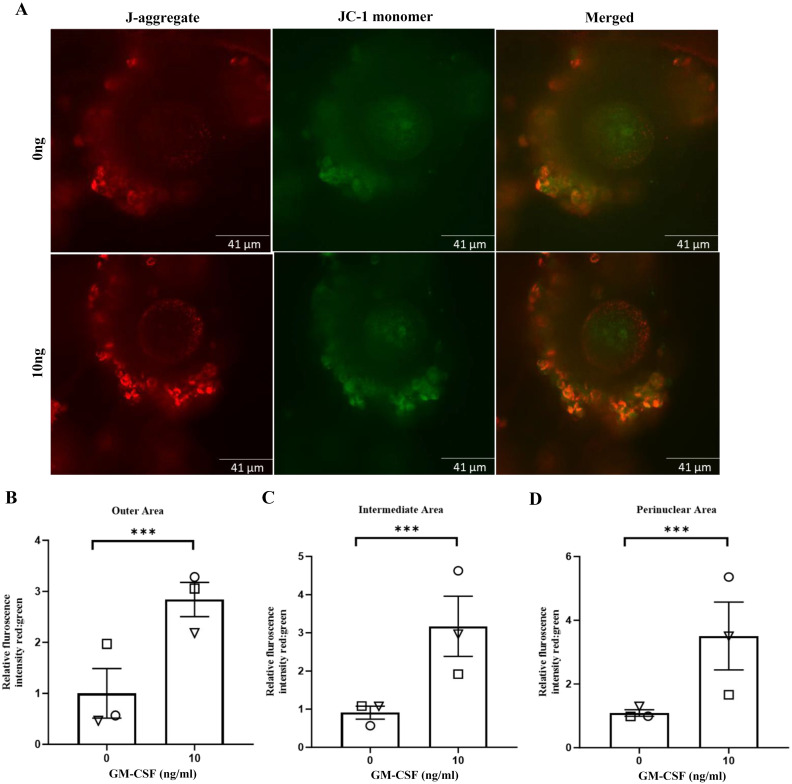
Fig. 4.
The effect of GM-CSF during IVM on MMP following IVM in AMA COCs at 16 h. (A) Representative images of COCs for 0 (control) and 10 ng/ml of GM-CSF, stained with JC-1 green and red fluorescence indicate JC-1 monomers and JC-1 aggregates, respectively. (B, C and D) GM-CSF increased MMP across all three areas. The data is expressed as mean ± SEM of three replicates and was determined in a minimum of six oocytes in each group per replicate. Different symbols represent the mean of each replicate across groups (*** P < 0.001).

