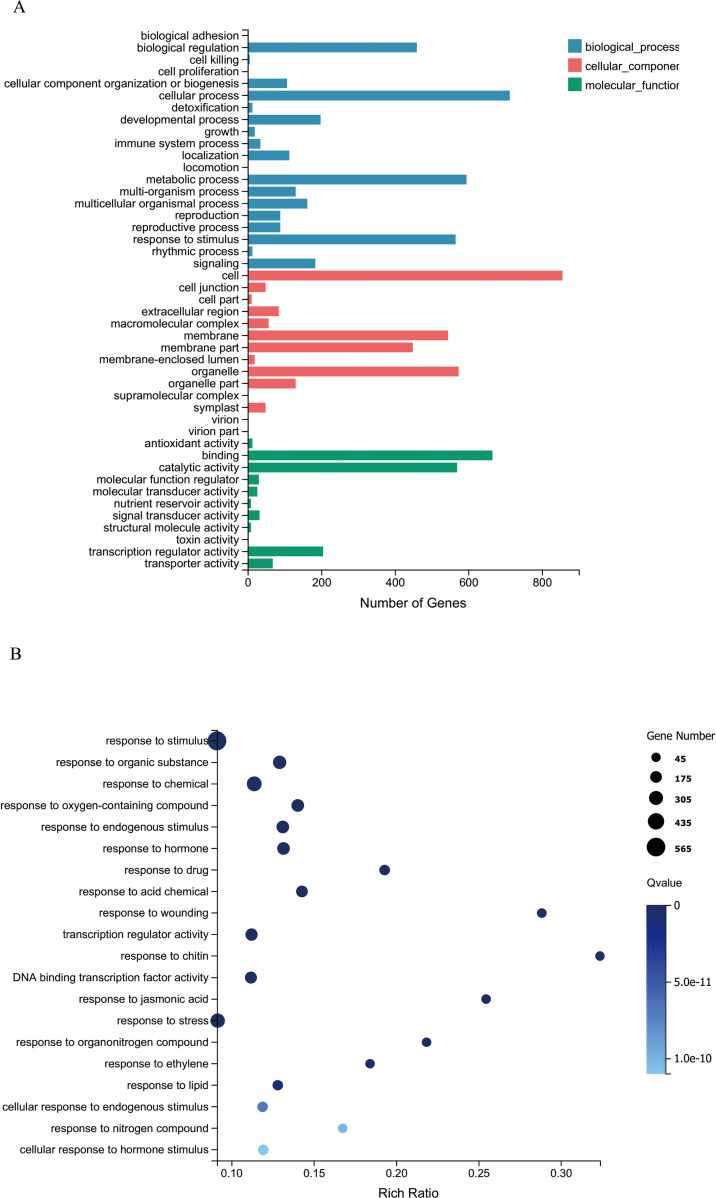
Figure 7.
Gene ontology (GO) enrichment analysis of differentially expressed genes (DEGs) in WT and CsRAB-overexpressing Arabidopsis transcriptome. (A) Classification of GO-enriched DEGs. The genes were assigned to three main categories, biological process, cellular component and molecular function. The numbers of DEGs and the names of the GO categories are presented along the x- and y-axes, respectively. (B) Scatterplot of GO-enriched functions of DEGs. The enrichment factor is the ratio of the DEG number to the total gene number in a certain pathway. The colors and sizes of the dots represent the q-value range and gene number, respectively.

