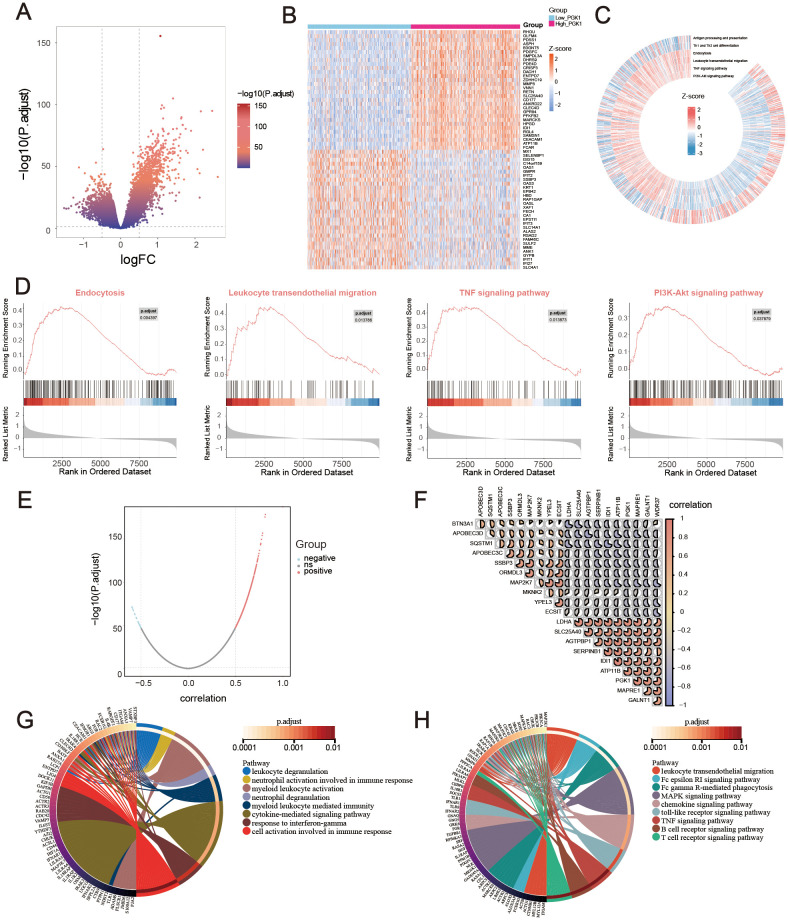
Figure 4.
Functional exploration of PGK1 in sepsis. (A) Volcano plot and (B) Heatmap for differentially expressed genes (DEGs) between high_PGK1 and low_PGK1 sepsis patients. (C, D) Gene set enrichment analysis (GSEA) and Gene Set Variation Analysis (GSVA) for the signaling pathways enrichment in different groups. (E) Volcano plot for PGK1-coexpressed genes in sepsis. (F) Correlation heatmap of top 20 PGK1-coexpressed genes, the pie size indicates the degree of correlation. Circos plot for GO (G) and KEGG (H) function enrichment analysis.

