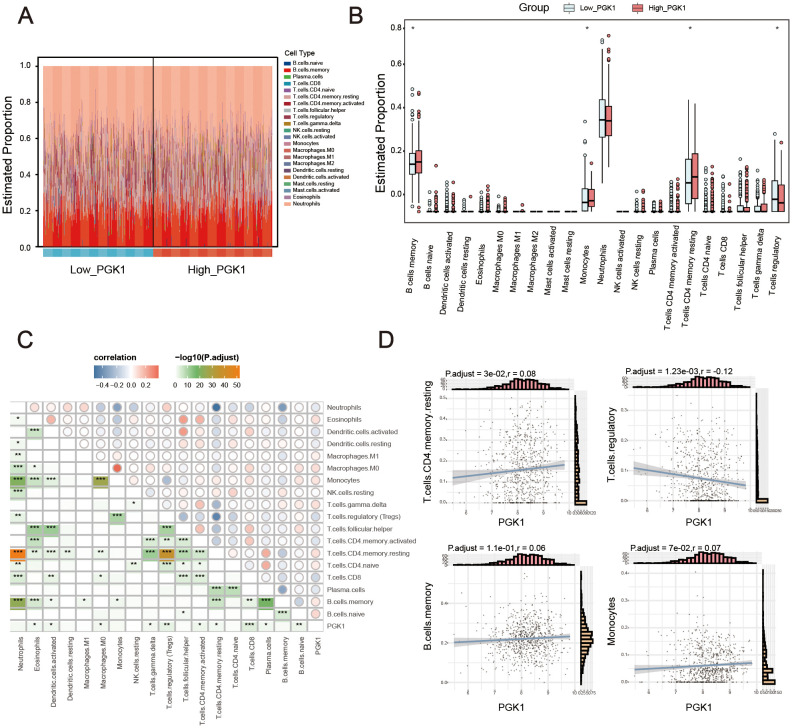
Figure 5.
PGK1 was closely related with immune infiltration. (A) Stacked bar chart displayed the landscape of 22 types of immune cells in high_PGK1 and low_PGK1 group. (B) Violin diagram showed the difference in immune infiltration between the two groups. (C) Correlation matrix of PGK1 and immune cell proportions, the pie size indicates the degree of correlation. (D) Correlation between PGK1 expression and immune cells. *P < 0.05, **P < 0.01, ***P < 0.001.

