Figure 7.
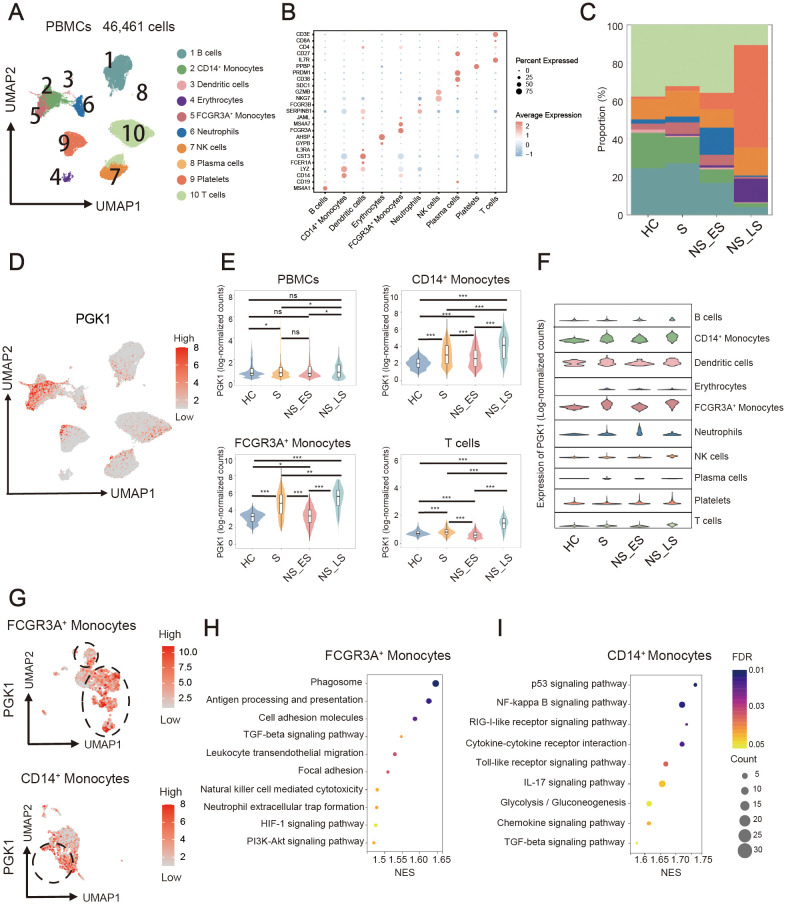
Single-cell transcriptomic profiling revealed the PGK1-related immune characteristic. (A) UMAP embedding plots of 10 cells by scRNA-seq profiles derived from sepsis patients and healthy people. (B) Expression distribution of cell identity specific RNA markers of sepsis cohort samples. (C) Proportions of cell clusters in healthy controls (HC), survivor (S), nonsurvivor, late-stage sepsis (NS LS), and nonsurvivor, early-stage sepsis (NS_ES). (D) UMAP plot represented PGK1 expression in distinct clusters. (E) Violin plots for the different proportion of cell subsets in HC, S, NS_LS, and NS_ES. (F) Abundance of major cell lineages in sepsis by scRNA-seq. (G) UMAP plot represented PGK1 expression in FCGR3A+ monocytes, and CD14+ monocytes. Bubble plots for GSEA enrichment of high_PGK1 and low_PGK1 (H) FCGR3A+ monocytes, and (I) CD14+ monocytes. NES, Normalized Enrichment Score. *P < 0.05, **P < 0.01, ***P < 0.001.

