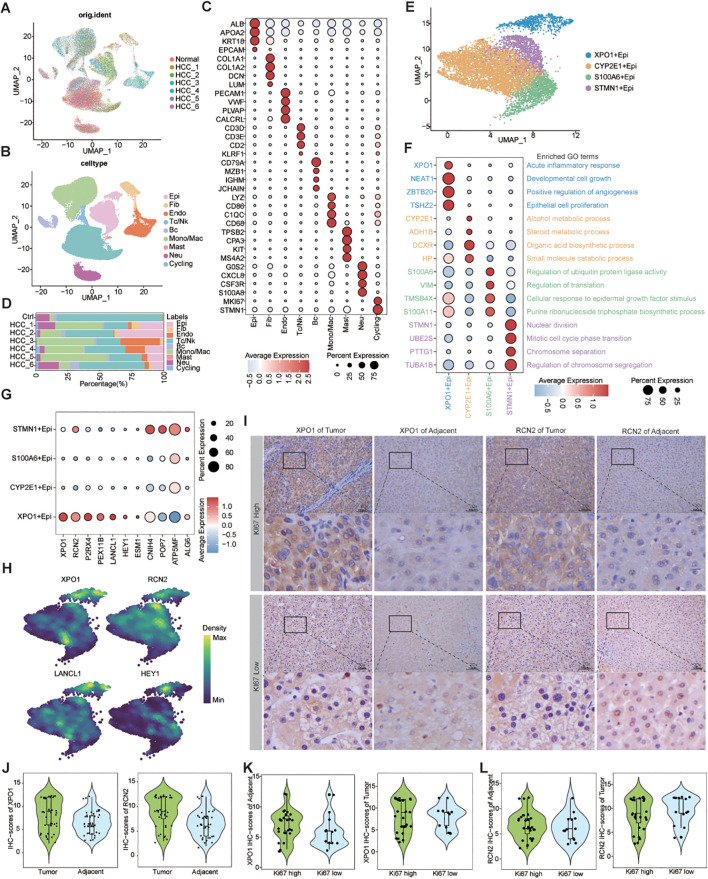
Figure 5.
Single-cell resolution exploration of the expression profiles of genes characterizing TP-TME risk subtypes in HCC. (A) UMAP plot illustrating the distribution of cells across different samples, with distinct colors representing each sample; (B) UMAP plot depicting the transcriptomic landscape of 62,163 high-quality cells across nine cell types, with different colors indicating the various cell types: Epi (epithelial cell), Fib (fibroblast cell), Endo (endothelial cell), Tc/NK (T cell/natural killer cell), Bc (B cell), Mono/Mac (monocyte/macrophage cell), Mast (mast cell), Neu (neutrophil cell), and Cycling (cycling cell). (C) Bubble plots displaying the percentage expression of classical marker genes across the nine cell types, alongside average expression levels. (D) Bar graph illustrating the distribution of the nine cell types across different tissues, color-coded by cell type. (E) UMAP plot showing the cluster of epithelial cells divided into four distinct cell clusters. (F) Bubble plots highlighting the percentage and average expression levels of genes with high expression specific to different epithelial cell clusters, as well as GO-BP functional enrichment. (G) Bubble plots presenting the expression percentages and average expression levels of genes characterizing the TP risk subtype across different epithelial cell clusters. (H) Density map illustrating the distribution of TP-related genes within epithelial cell clusters. (I) IHC staining of XPO1 and RCN2 in clinical samples from HCC adjacent and tumor tissues. (J) Violin plot demonstrating the statistical analysis of IHC scores for XPO1 and RCN2 genes. (K, L) Violin plots displaying IHC scoring statistics for XPO1 (K) and RCN2 (L) under varying levels of Ki67 expression.

