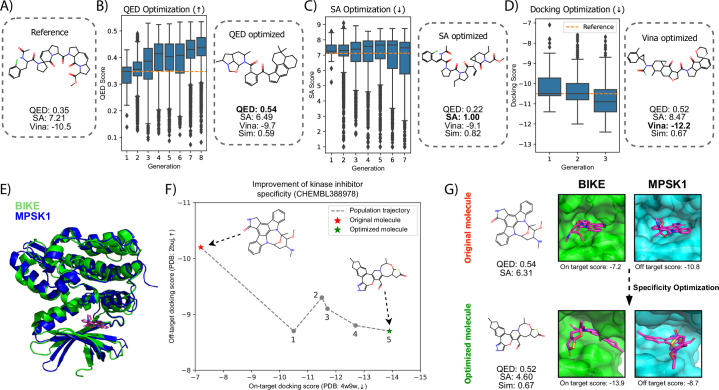
Extended Data Fig. 2. Results on molecular optimization using DiffSBDD.
(A-D) Experiments on single property molecular optimization. (A) Starting inhibitor from PDB code 5ndu. (B) QED optimization over 8 generations. (C) SA optimization over 7 generations. (D) docking score optimization over 3 generations. We found that optimization over subsequent generations continuously optimized the docking score, but that was at expense of molecular quality. (E-G) Kinase inhibitor specificity optimization experiment. (E) Cartoon representation showing the high degree of structural similarity between our two kinases of interest (BIKE and MPSK1). (F) Trajectory plot showing the highest scoring molecule at each iteration during kinase inhibitor optimization. (G) Visual representation of the molecular graphs and bound conformations of the native and final molecules with corresponding Vina docking scores. Boxes in panels (B-D) represent the upper and lower quartile as well as the median of the data. Whiskers denote 1.5 times the interquartile range. Outliers outside this range are shown as flier points. Sample sizes for each generation are 80, 4474, 4390, 4460, 4459, 4470, 4472, 4474 for panel B, 84, 4500, 4500, 4500, 4500, 4500, 4500 for panel C and 118, 432, 437 for panel D. Carbon, oxygen, nitrogen and sulfur are shown in magenta, red, dark blue and yellow, respectively. QED: Quantitative Estimation of Drug-likeness; SA: Synthetic Accessibility; Sim.: Tanimoto molecular fingerprint similarity to the reference.

