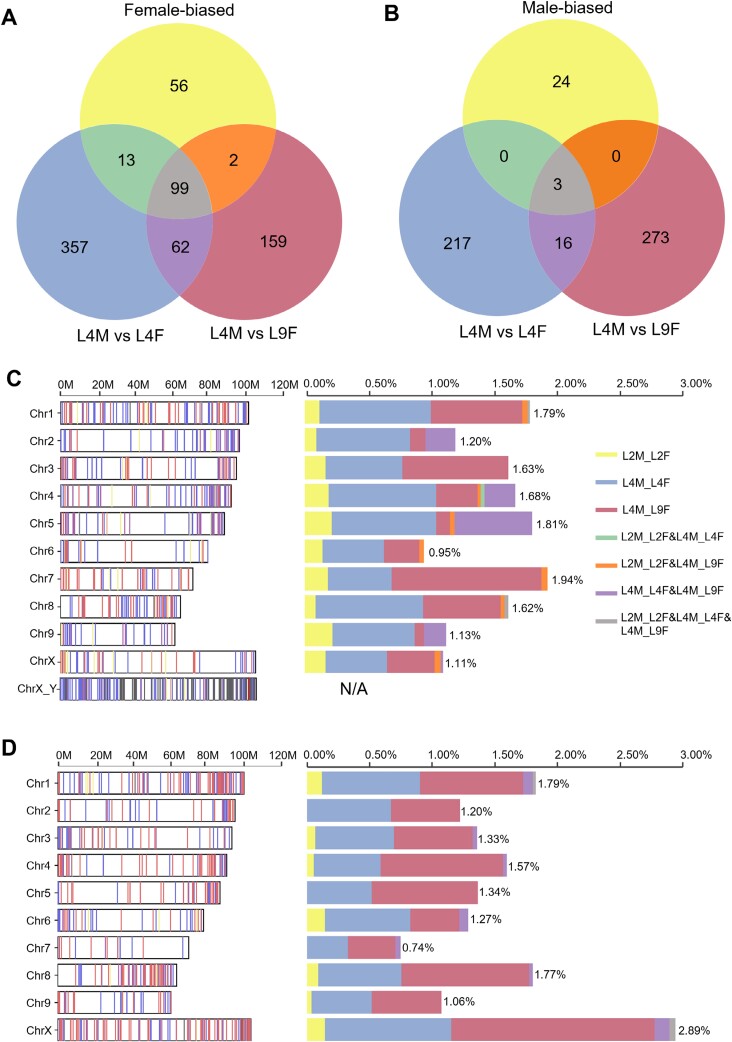
Fig. 4.
Sex-biased genes across developmental stages and their chromosomal distribution. (A, B) Venn diagrams demonstrating the overlap of female-biased (A) and male-biased (B) genes across L2M versus L2F, L4M versus L4F, and L4M versus L9F comparisons. (C, D) Distribution of male-biased (C) and female-biased (D) genes on different chromosomes. For ChrX_Y the position of the closest BLAST hit of each putative Y transcript on chromosome X is plotted. The percentage bars indicate the percentage of sex-biased genes relative to the total number of genes on this chromosome.

