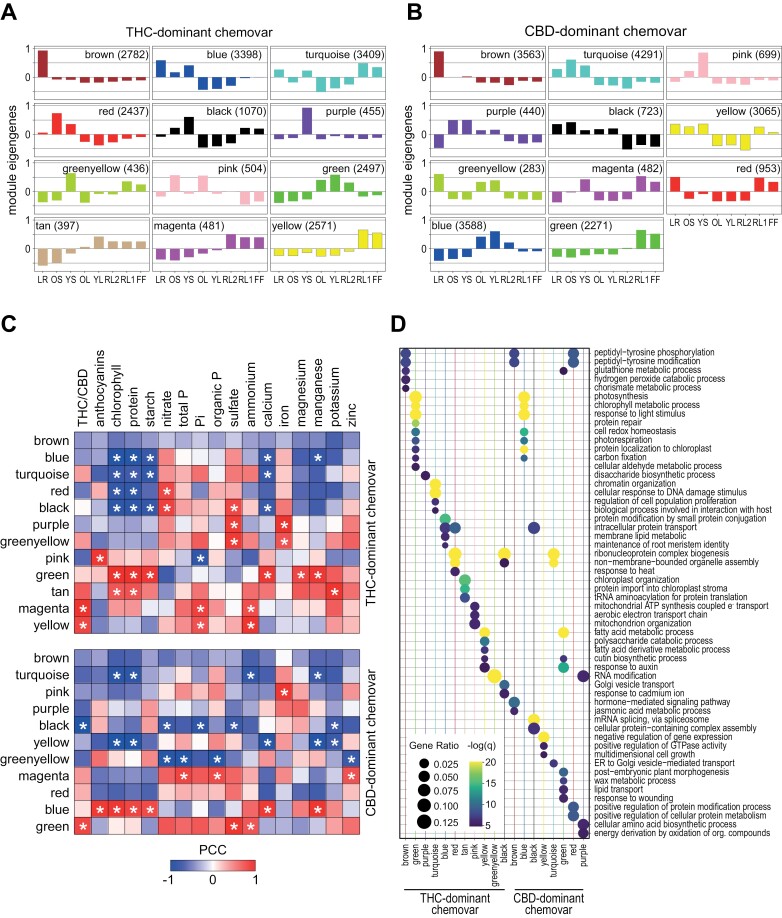
Fig. 7.
Co-expressed genes are correlated with specific traits and enriched for GO terms. (A, B) Module eigengenes identified across organs of the THC- (A) and CBD-dominant (B) chemovar as proxies for the average expression of genes within each module (Langfelder and Horvath, 2008). Modules across chemovars share organ specific expression of their corresponding genes. (C) Gene expression patterns of each module, represented by their module eigengenes, were correlated with quantified traits for both chemovars. Colour scale indicates the Pearson correlation coefficient and asterisks statistically significant correlations (P<0.05). (D) Comparison of GO term enrichment for genes in the modules of the two chemovars. For the analysis, genes with a module membership value (kME) of above 0.9 were used. Dots sizes indicate the gene ratio (ratio of module genes to all genes associated to GO term) and colour scale the statistical significance (−log10 of the false discovery rate). Abbreviations: CBD, cannabidiol; FF, female flower; LR, lateral roots; OL, YL; oldest and youngest fully expanded fan leaf pair; OS, YS; oldest and youngest stem internodes; RL1, higher order reduced (‘sugar’) leaves; RL2, lower (second to fourth) order reduced leaves; THC, tetrahydrocannabinol.

