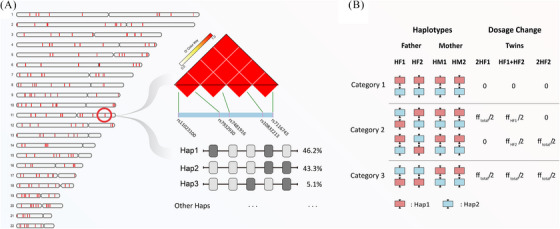
FIGURE 1.

Schematic representation of linkage disequilibrium (LD)‐blocks on autosomal chromosomes. (A) The distribution of 1–22 autosomal chromosomes comprising 207 blocks, with red areas indicating block regions. Display linkage disequilibrium analysis plots for five single nucleotide polymorphism (SNP) markers within the chr11: 14160504–14202168 region, along with the probabilities of the two main haplotypes (hap1 and hap2). (B) The classification principle for SNP sites is based on maternal and corresponding paternal samples. Red squares represent hap1, while blue squares represent hap2.
