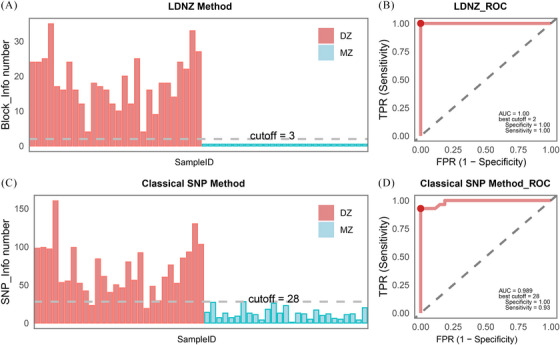
FIGURE 3.

Histograms and receiver operating characteristic (ROC) analysis for linkage disequilibrium information‐based noninvasive zygosity (LDNZ) method and classical single nucleotide polymorphism (SNP)‐based method (A) Histogram showing the distribution of the number of informative blocks identified by the LDNZ analysis. (B) ROC curve analysis for the number of informative blocks identified by the LDNZ method. At the optimal model prediction performance, the best cutoff value is 2, with specificity, sensitivity, and area under the curve (AUC) equal to 1. (C) Histogram showing the distribution of the number of informative loci identified by the SNP analysis. (D) ROC curve analysis for the number of informative SNPs identified by the SNP method. At the optimal model prediction performance, the best cutoff value is 28, with a specificity of 1.00, a sensitivity of 0.93, and an AUC of 0.989.
