
Figure 4.
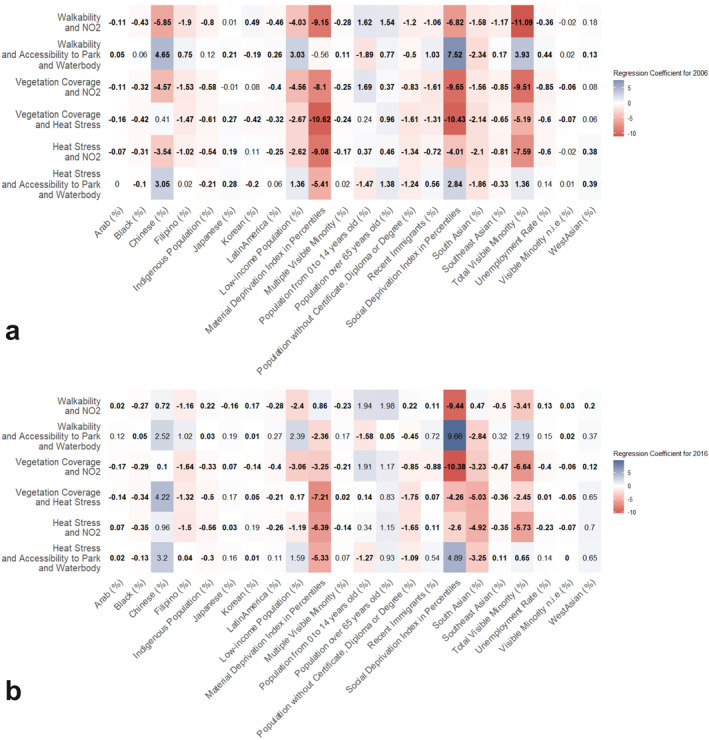
Heat Map for Regression Coefficients among Demographic Groups and Environmental Combinations in 2006 (a) and 2016 (b) (Quartile Method). We define inequity as a negative linear relationship between the marginalized demographic group percentage and the environmental category, indicated by a negative regression coefficient in red. Blue indicates no inequity identified for the given marginalized groups resulting from the positive linear relationship between demographic percentage and environmental category. Numbers in bold indicate that the coefficients are statistically significant; numbers that are not in bold (regular font) suggest no statistically significant inequity was identified, indicated by regression coefficient with a p‐value exceeding 0.05.