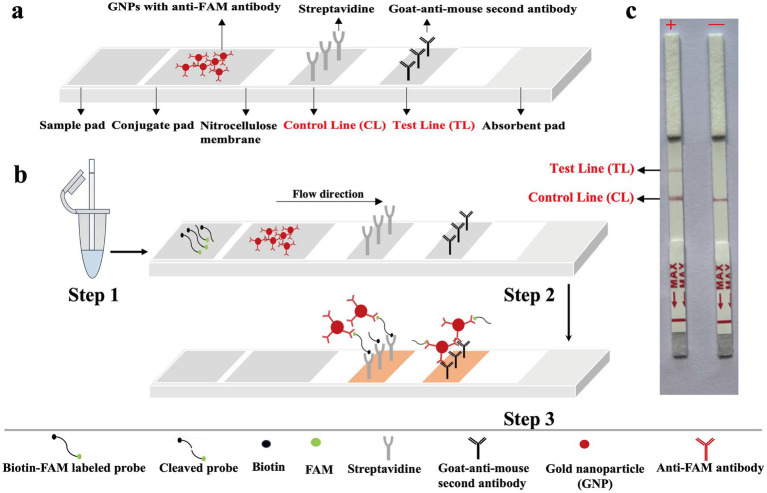
Figure 2.
The principle for visualization of MCTOP products by biosensor. (A) The details of biosensor design. (B) The schematic of biosensor for MCTOP products visualization. (C) Schematic illustration of the MCTOP results interpretation. +, results of positive MCTOP test (clearly visible red lines for both control line (CL) and test line (TL) were present on the biosensor); −, results of negative MCTOP test (only the control line (CL) was present on the biosensor).

