Figure 4.
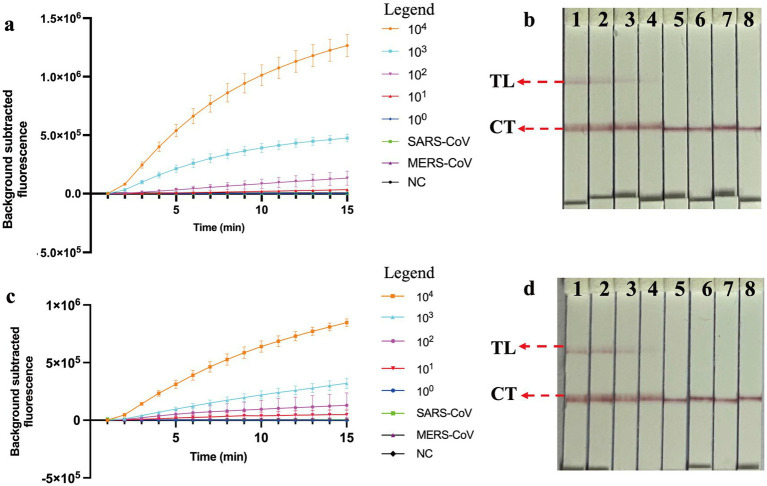
Sensitivity and specificity analysis of COVID-19 MCTOP assay. (A,C) COVID-19 MCTOP results were reported by real-time fluorescence (A) for ORF1ab-MCTOP result, and (C) for N-MCTOP result. Error bars represent the means ± standard error of means (SEM) from three replicates. (B,D) COVID-19 results were reported by lateral flow biosensor (B) for ORF1ab-MCTOP result, and (D) for NP-MCTOP result. Signals (A) /Biosensors (B) 1–8 represented the results of corresponding ORF1ab-plasmid levels of SARS-CoV-2 from 1 × 10⁴ to 1 × 100 copies, and 1 × 10⁴ copies ORF1ab-plasmid of SARS-CoV and MERS-CoV, respectively, and ultrapure water served as negative control (NC). Signals (C) /Biosensors (D) 1–8 represented the results of corresponding N-plasmid levels of SARS-CoV-2 from 1 × 10⁴ to 1 × 100 copies, and 1 × 10⁴ copies N-plasmid of SARS-CoV and MERS-CoV respectively, and ultrapure water served as negative control (NC). Control line (CL), Test line (TL).

