Figure 2.
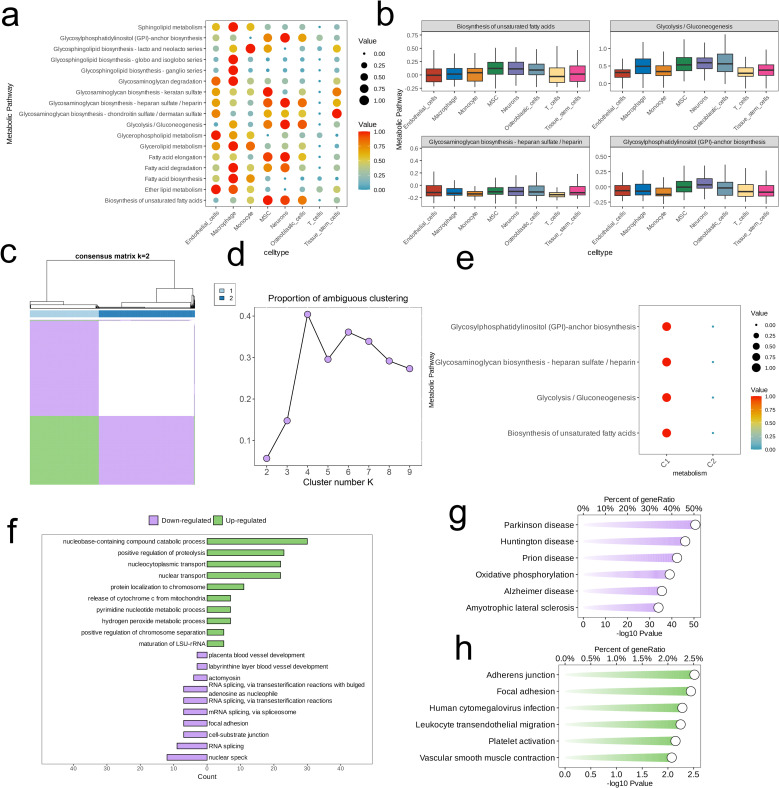
Identification of cell clusters with highly activated metabolism activities in OS at the single cell level. (A) The highly activated metabolic process of in each cell cluster revealed by the “scMetabolism” R package. (B) Boxplots showing the activities of four highly activated metabolic pathways in osteoblastic cells. (C) Consensus matrix(k=2). (D) The proportion of ambiguous clustering (PAC) score, a low value of PAC implies a flat middle segment, allowing conjecture of the optimal k (k = 2) by the lowest PAC. (E) Two distinct metabolism patterns of OS at the single-cell level unraveled by the unsupervised clustering. (F–H) Barplot reveals the dysregulated GO-BP terms (F) and KEGG pathways (G, H) in OS cells with highly activated metabolism activities.

