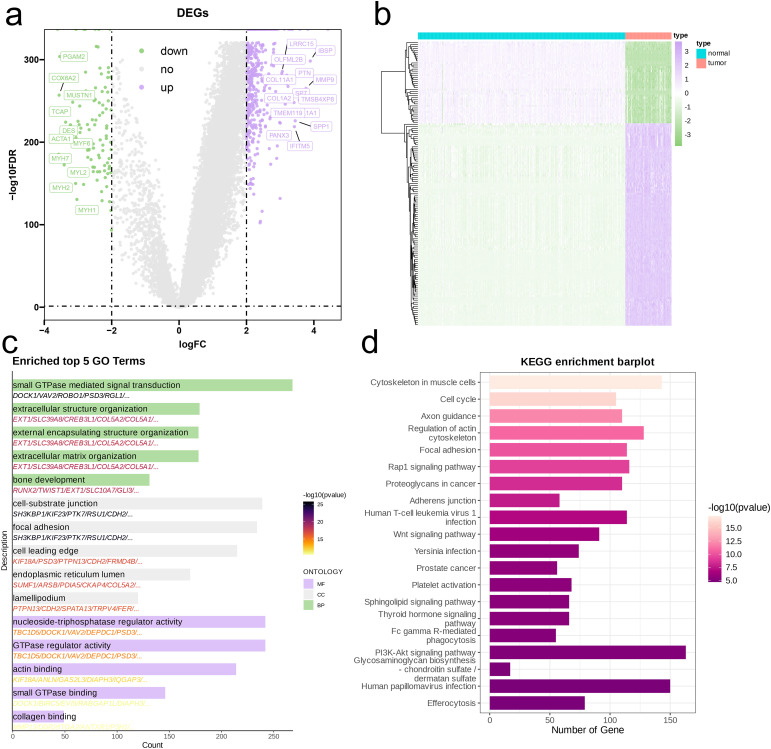
Figure 4.
Identification and functional enrichment analysis of DEGs between OS patients and controls. (A) Volcano plot of DEGs between OS and control in the merged cohort of TARGET-OS and GTEx. P<0.05 and |log2FoldChange|>1 were identified as significant DEGs. (B) b Heatmap of DEGs. (C, D) Barplots of the BP, CC, MF (C), and KEGG pathways (D) of DEGs.

